If you’ve been keeping up with Facebook ads news recently, you’ve probably heard the acronym CBO (that stands for Campaign Budget Optimization) mentioned a lot.
This is because Facebook CBO is a radical change in how Facebook distributes the budget within a campaign and, for some accounts, it will become the only option available in September.
When this feature takes effect, Facebook will be switching over both your existing campaigns and the new ones. You should start testing Facebook CBO as soon as possible.
And the first test is free because we invested $1,000 to answer the question does CBO truly produce better results than manual budget allocation?
Up until now, the budget of your Facebook ad campaigns has been managed at adset level, giving the advertiser precise control over how much budget each audience gets.
With CBO the user gets less control as the budget is set at the campaign level, and then Facebook itself decides how much to allocate to each adset.
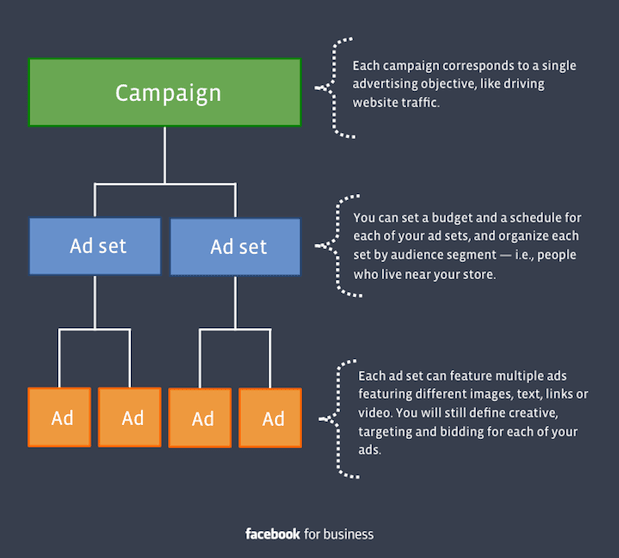
Here’s a reminder of the Facebook ad campaign structure, with CBO moving the budget from the adset level (blue boxes) higher up to the campaign level (green box).
For a full explanation on how CBO works, check out our in-depth guide here.
With CBO budget allocation acting within a black box, along with it becoming compulsory for many in September, there have been many questions raised for advertisers including:
-
Does CBO truly produce better results than manual budget allocation?
-
Will each adset still get a good proportion of the budget, or will all the budget go to the best adset?
-
Will Facebook give each adset enough budget for a fair test before picking a winner?
There’s only one way to find out, and that’s by putting some real ad dollars behind a campaign in our latest $1,000 experiment.
Do You Want To Master Facebook CBO?
What about attending a special master class to learn all the secrets of Facebook Campaign Optimization for FREE!
To learn from the bests, click here to reserve your FREE seat for our next webinar on Thursday 8/22 (at 10 am Pacific Time).
In this exclusive one-hour training, our Facebook Ads Specialist Paul Fairbrother will explain what CBO is and how to set up your campaigns to get the most from it.
We’ll also reveal how CBO allocates the campaign budget across different audiences.
Click to register now, and if you can’t make it or want to watch it again we will send you the recording!
Facebook’s CBO Experiment Setup
The key element of the campaign setup was the audiences, to see how CBO would handle different audience sizes with different CPA’s.
So, we created 1% lookalike audiences for the US, UK, and New Zealand, based on previous webinar registrations.
The size of a lookalike audience depends on the total adult population in that country that has a Facebook account, therefore the 1% lookalikes for different countries were very different in size:
- Lookalike (US, 1%) – Complete Registration (Pixel) 180 Days – 2,100,000 people
- Lookalike (GB, 1%) – Complete Registration (Pixel) 180 Days – 410,000 people
- Lookalike (NZ, 1%) – Complete Registration (Pixel) 180 Days – 31,000 people
Here’s the ad we used:
This took people to a landing page where we fired the Complete Registration pixel event upon form submission.
The rest of the campaign setup was:
- Budget: $1,000 spread over 11 days, with Campaign Budget Optimization selected
- Optimization: the campaign was optimized for conversions and billed on impressions
- Bid strategy: lowest cost without cap
- Placements: Facebook newsfeed; desktop and mobile
- Exclusions: current complete registrations were excluded from being served the ads
Experiment Hypothesis
Our expectation was that budget allocation might be erratic in the first few days until there was enough data to pick a winning audience.
So our hypothesis was:
- Large daily swings in the budget for the first few days
- Once there were enough conversions, the winning adset would get a vast majority of the budget, with stable daily budget allocation
Our prediction also depended on which audience had the lowest cost per registration (CPA).
We expected the UK to have the lowest CPA, simply because ad pricing is very high in the US, whereas UK audiences have similar conversion rates but the CPM (cost per 1,000 impressions) is a lot less.
The New Zealand audience was predicted to result in a higher CPA as small audiences (less than one million) usually have a higher CPM than broader audiences.
Our hypothesis meant we wanted to monitor three things:
- Track the daily budget allocation, to see if it was stable or if there were large daily shifts
- Did the audience with the lowest CPA get the majority of the budget?
- Was there enough budget initially to test all the audiences before a winner was chosen?
Experiment Results
Overall the campaign was successful with 494 webinar registrations at just over $2 each.
A 1.4% click-through rate and $1.45 cost per click were also good for a niche B2B campaign running to cold traffic.
Next, let’s drill down to the adset level.
We can see that the US is the best-performing country with the lowest CPA and CPC and highest CTR.
The UK was in the middle and New Zealand had the highest cost per webinar registration.
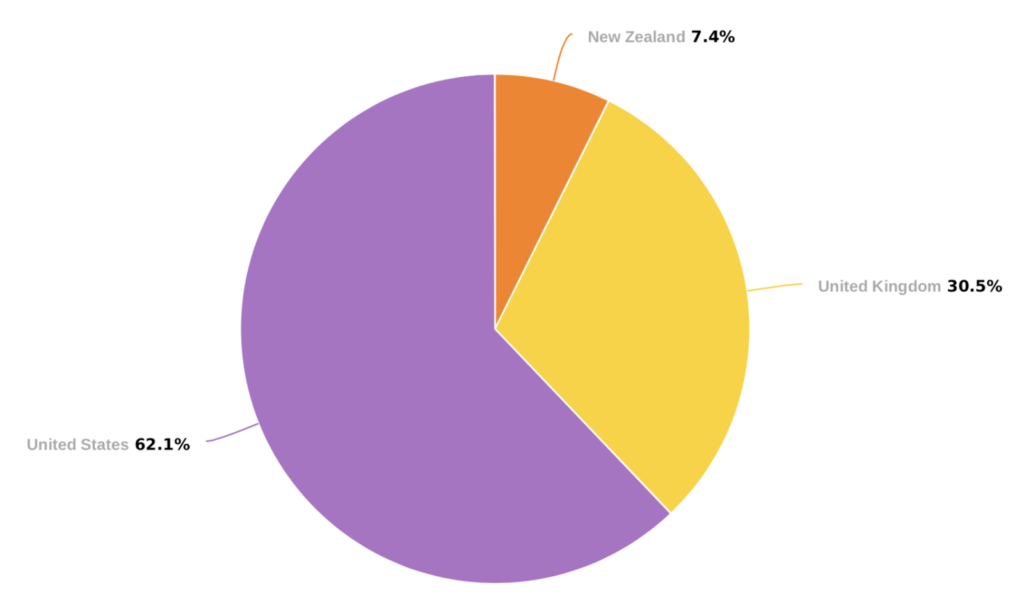
In line with this, the results show that Facebook did give most of the budget to the US, with the UK getting the next largest share and New Zealand the smallest allocation.
How did Facebook do with daily spend distribution?
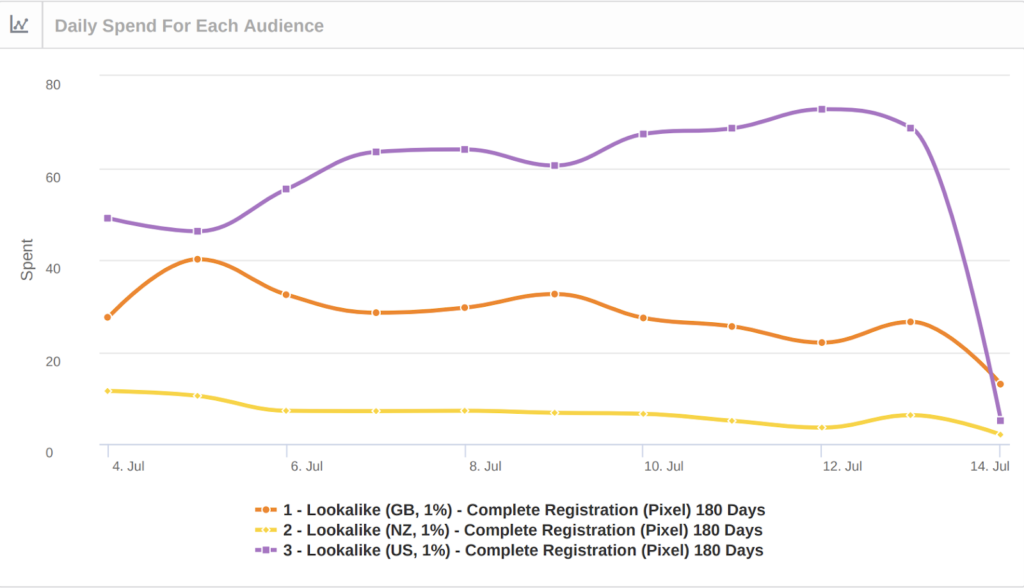
We can see that there was no major day to day fluctuations, instead, Facebook gave all of them a reasonable budget dependent on the audience size to start with.
As it became clear the US had the lowest CPA, it optimized the campaign correctly by shifting more budget to the US and less to the UK and New Zealand:
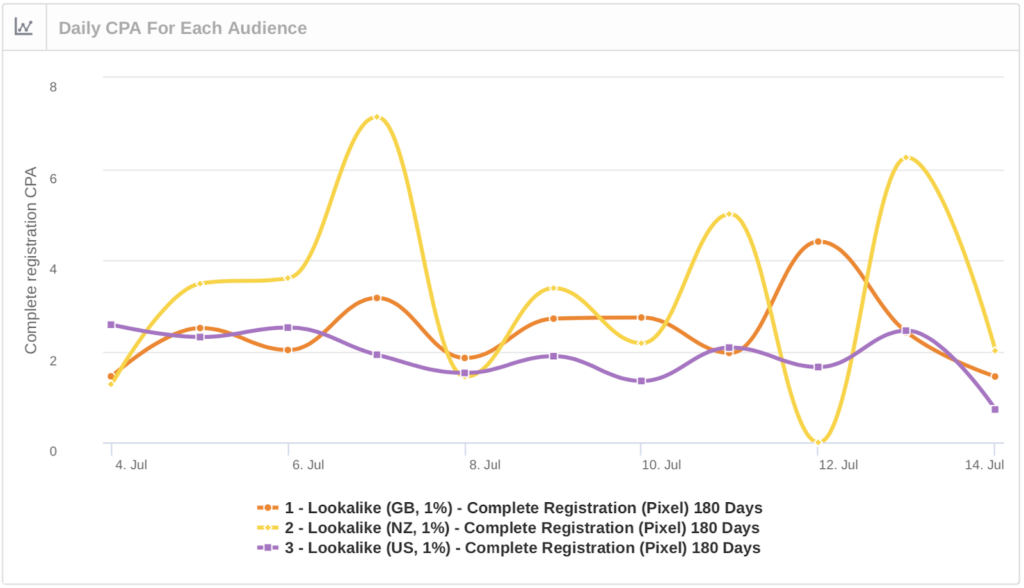
Turning our attention to the daily CPA rates, we can see that on day one New Zealand and the UK gave the best results.
After this, results were reasonably stable with the US consistently having a good CPA (purple line).
New Zealand has more daily variation, which is presumably down to the smaller daily budget.
Experiment Conclusions
-
Facebook gave smaller countries more budget than would be expected based on their audience sizes
The table below shows that Facebook wasn’t just distributing the budget according to audience size, it gave extra to New Zealand and UK. However, it also wasn’t just distributing the budget evenly between each audience.
-
The countries with the lowest cost per registration got the most budget
CBO was effective at giving more budget to the US where the cost per registration was cheapest.
-
Overall, CBO has done a reasonable job with budget allocation.
It has given each audience enough budget to properly test it, and there haven’t been any wild daily budget swings.
For new advertisers or those that want a hands-off approach, the way CBO allocated the budget was better than even distribution (too much would have gone to the more expensive countries) or proportionate distribution (not enough budget would have been allocated for testing).
Could advanced advertisers get better results by manually adjusting the budgets?
Perhaps, but we also need to pay attention to the breakdown effect.
This is where we have to consider what would happen to the cost per registration if we move all the budget to the cheapest audience.
Although the US was $1.88 per registration, there are only so many cheap conversions per audience, and extra registrations from the US might have cost more than getting a few moderately priced results from the other countries.
Final Thoughts
There’s been a lot of concern about the transition to CBO so here are our key points for getting the most out of it:
-
CBO, on the whole, gives good results
So if you’re just starting out with Facebook ads or don’t want to micromanage your campaigns, using CBO makes sense.
-
For advanced Facebook advertisers, the benefits are smaller,
But it can still be useful as it takes into account the breakdown effect.
-
Setting minimum and maximum budget levels for each adset prevents extreme budget shifts, and ensures everything gets some budget.
Which is especially useful in the initial testing phase.
Facebook recommends not to use budget caps for each adset, so consider reserving the option just for cases where you are seeing very uneven budget distribution.
Start testing CBO now if you aren’t already, as for some accounts it will become compulsory in September.
To begin with, just switch over a couple of campaigns, see what results it gives, and then build from there.
What results are you seeing with CBO? Do you prefer it to manual budget allocation? What proportion of your campaigns is using CBO? Let us know your thoughts in the comments below.




great experiment. Very interesting to learn that facebook allocated more budget for the USA which yielded higher leads. I think that this new feature about campaign budget optimization is a great helpful feature for advertisers. Because it is always great if we are going to spend more money on the geographies/audience/ad sets which are giving higher returns.
Great experiment, thanks for sharing