Facebook ads are a science and an art. Looking at Facebook ads examples is one of the best ways to learn how to create your own. It also gets the creative juices flowing and help you come up with your own original ideas.
As organic reach declines, knowing how to create effective Facebook ads is more important than ever.
Posting on your Facebook business page is no longer a guarantee that your followers will see your posts. And if you decide to put money behind that content, you’ll want to make sure your efforts pay off.
Find out what works for other brands before creating your own.
In the right column (and below, for your convenience), you’ll find the list of all different Facebook ads formats we selected.
Check them to see how other brands are advertising on Facebook, or click on the one you are planning to use and read our tips to create your own great Facebook advert.
-
Facebook Photo Ads examples
-
Facebook Video Ads examples
-
Facebook Carousel Ads examples
-
Facebook Slideshow Ads examples
-
Facebook Lead Ads examples
-
Facebook Offer Ads examples
-
Facebook Messenger Ads examples
Are you ready to unleash your creativity and boost your Facebook Ads results?
Browse this collection of some of the best Facebook ads to get started.
Then read our more detailed guide to advertising on Facebook to learn about audience targeting, best practices, specs, and more.
Best Facebook Ads Examples: Photo Ads
Sometimes referred to as “image ads,” photo ads are a simple, effective way to build brand awareness and engagement.
Airtable
What’s great about this ad:
- Short, straightforward copy. In just 21 words, Airtable describes its major value proposition (a platform for designing flexible editorial workflows) and engages viewers with a question.
- Eye-catching image. I don’t know about you, but my thumbs slow down for cute dogs when I’m scrolling through my Facebook feed. This friendly, sleepy dog has nothing to do with the software for sale, but it makes me curious. I might even click on it. Note: there’s a fine line between using cute images of puppies to express the mood of your brand and misleading viewers with clickbait. DON’T do the latter.
- Effective landing page. If you click on this ad, you’ll be taken to a landing page that describes the product—and why it’s valuable—in more detail. This is a tried-and-true online marketing strategy that even the most beginner brands can make use of. It’s also a good reminder that you don’t have to say everything in your ad.
ClassPass
What’s great about this ad:
- Clear benefit. A classic copywriting trick is to describe the benefits of your product rather than the features. For example, “water-resistant” might be a feature of the watch you’re selling, but the fact that you can know what time it is, even while swimming, is the clear benefit. ClassPass puts the benefit of their product upfront: not having to commit to one type of exercise.
- Clear call-to-action (CTA). People need to know what action you want them to take next. “Try two weeks free” is about as clear as it gets.
- Text Overlay. ClassPass has taken the opportunity to highlight its catchy tagline by pasting it over its ad’s image, front, and center. With the right graphic design, this can be an effective strategy. But don’t add too much text. Use Facebook’s Text Overlay Tool to make sure the proportion of text to image aligns with their guidelines, or else your ad may be served to fewer people.
Waze
What’s great about this ad:
- Clear and Concise. Without having to read the headline or the description, you instantly know who this ad is for and what it’s about.
- The image reiterates the offer. The image allows the audience to visualize the offer – advertising on the Waze app.
Go Back To Facebook Ads Examples List
Best Facebook Ads Examples: Video Ads
Video ads put photos ads into motion with GIFs or short clips.
Facebook has been banking on mobile video, and with good reason. Research shows that people associate mobile videos with positive emotions. That makes video ads a great way to build brand awareness through storytelling.
Headspace
What’s great about this ad:
- Designed for sound off. Approximately 85 percent of Facebook videos are watched without sound. Headspace’s video uses text and illustration to communicate its message effectively in any environment, while also making it accessible for viewers with hearing impairments.
- Short and sweet. At 11 seconds in length, Headspace’s video may seem short, but it’s not. Attention spans are short online, and when it comes to video, advertisers have under two seconds to capture attention. Headspace grabbed mine with the question: “Feeling Awkward?” (The answer is almost always yes.)
- Simple messaging. In addition to keeping the video brief, the message in the video is clear: Subscribe to Headspace. Sometimes a direct call-to-action is all you need.
The New Yorker
What’s great about this ad:
- Effective branding. There isn’t any doubt as to who published this ad. The logo and signature style says The New Yorker all the way through.
- Inclusive illustrations. In addition to being playful and smart, the series of characters in the video reflect a broad array of potential New Yorker readers. This increases the odds of someone saying, “Hey, that’s me,” and is a hidden form of persuasion. For added inclusivity, the video is also sound-free.
- Upfront and to-the-point. At only six seconds in length, this video likely has a good completion rate. But even if it doesn’t—a Facebook study finds the majority of viewers bail after 1.7 seconds—the New Yorker’s message will have reached its audience. The call-to-action is present from the moment the video starts.
Tokyo Treat
What’s great about this ad:
- Product-focused. In just a few seconds, this video clearly communicates the product and offer. The bright colors also attract attention against a bland newsfeed background.
- Free shipping and a bonus offer. Usually, free shipping is an eye-catcher all on its own, but by combining free shipping WITH a bonus coupon, TokyoTreat is giving additional incentive to sign up.
Go Back To Facebook Ads Examples List
Best Facebook Ads Examples: Carousel Ads
Carousel ads showcase between two and ten images or videos that people can swipe through. It’s basically the Tinder equivalent of Facebook ads.
This format is ideal if you have multiple products, features, or different points you want to advertise.
Hello Fresh
What’s great about this ad:
- Highlights variety. If variety is a selling point for your brand, the carousel format helps to showcase this. Hello Fresh takes full advantage by featuring four different meals.
- Appetizing imagery. Tempting visuals of food are an excellent way to make people hungry for more—and the carousel format delivers. Putting the product in focus with high-quality photography is a good way to inspire cravings.
- Make it look easy. For those unfamiliar with Hello Fresh’s business model, some assemblage is required. This ad demonstrates how the food kits work in five pictures: Make different meals with a box of pre-portioned ingredients and easy recipes.
Guardian Weekly
What’s great about this ad:
- Vibrant imagery. The Guardian’s signature bold typeface against a bright yellow background makes this ad pop in the News Feed. Colorful graphics in the magazine shots carry vibrancy throughout the carousel, encouraging more clicking.
- Clear selling points. The carousel format allows brands to divide and conquer by showcasing multiple products, features, or points of entry. The Guardian’s carousel ad delivers with concise selling points: “Get a progressive perspective,” “Discover unheard voices,” and “Enjoy independent journalism.”
- Link continuity. The call-to-action for this carousel is consistent and clear: Subscribe. When clicked, the webpage you land on features the same messaging and visual themes that are represented in the ad. This signals to customers that they’re in the right place, and helps deliver quality conversions.
Boredwalk
What’s great about this ad:
- Uniquely un-unique. While selling t-shirts is by no means a new trend, Boredwalk has cornered a niche market by creating shirts and targeting those who would best enjoy them (those interested in philosophy, psychology, etc.).
- It inspires laughter. The best sorts of social posts are those that elicit emotion, and laughter is one of the best to go for.
Go Back To Facebook Ads Examples List
Best Facebook Ads Example: Slideshow Ads
To make it easy, we can say that Facebook Slideshow ads put photos in motion.
The low-cost, lightweight format is an excellent way to catch attention with customers in low-bandwidth environments.
Facebook Slideshow ad example to inspire you:
Novus
What’s great about this ad:
- Artful animation. Old-fashioned animated slides are a smart way to bring photos to life. For low-budget creators, animated illustrations can be a clever solution.
- Light humor. As a Vancouver-based Internet service provider, Novus knows its customers are just as likely to devour data bytes are they are to devour sushi bites. A little double entendre goes a long way.
- Hitting the mark. The best place to advertise high-quality internet is in a low-bandwidth environment. By using the carousel format, Novus ensures it can reach prospective customers with quality content.
The New Yorker
What’s great about this ad:
- Attention to detail. The New Yorker’s offer is simple: 12 weeks for $12, and that offer is reinforced by 12 people reading 12 uniques issue. Who’s counting? New Yorker readers, probably. Scrupulousness is 100 % of the mag’s brand.
- Clear offer. What you see in this slideshow is pretty much exactly what you get: 12 issues to read every week.
- A fun spin. Repeated images of people reading a magazine could get tedious, but this ad spins the idea on its head—or, in front of its heads. The playful stick-your-nose-in poses are fun to watch through to the end.
Go Back To Facebook Ads Examples List
Best Facebook Ads Examples: Lead Ads
A lead ad uses an image, video, or carousel, followed by a CTA that leads to a form where businesses can collect a variety of information from interested users.
This info is collected on a mobile-friendly lead form that is pre-populated with information from the user’s profile.
Design Pickle
What’s great about this ad:
- Straightforward incentive. The tradeoff for filling out Design Pickle’s lead ad form. You give them some information; they give you some information in the form of a downloadable guide.
- Super short form. Brands can ask up to 15 questions with lead ad forms, but Design Pickle follows Facebook’s advice and keeps its Qs to a minimum. With the email and name fields pre-populated, all someone has to do is select a multiple-choice response.
- Multiple choices with quirk. Design Pickle created a custom multiple choice question and added a touch of brand flavor to the options. Answers to the question “What’s Your Design Pickle?” range from: “My designer is slammed,” to “I’m not good at graphic design.”
America’s Test Kitchen
What’s great about this ad:
- Offer a taste with video. After realizing that video was better at capture leads, America’s Test Kitchen began creating lead ads with snackable videos.
- Two-step forms. It’s pretty effortless to complete one of these forms. All users have to do is click “Sign up” and then submit their pre-populated email address.
- Foolproof incentive. The benefit of signing up for America’s Test Kitchen newsletter is pretty obvious: expert foolproof recipes delivered straight to your inbox.
Digital Marketer
What’s great about this ad:
- Eye-catching. By starting off with Check This Out in big, bold letters, Digital Marketer is able to catch the viewers’ attention within the first 3 seconds.
- Clear value prop. The copy is very clear about what the user will receive and the benefits of the downloadable.
Go Back To Facebook Ads Examples List
Best Facebook Ads Examples: Offer Ads
Facebook Offer ads are most frequently used to promote discounts or exclusive deals on products.
They can appear as an image, video, or carousel.
WestJet
What’s great about this ad:
- Location-specific. This ad obviously makes use of geographic targeting to be seen by people likely to fly to Calgary (i.e., me, a Canadian living in Vancouver). Read more about using Facebook Audience Insights to improve targeting.
- Eye-catching image. In some ways, advertisers in the travel industry have it easy. This gorgeous picture of a train chugging through snow-covered mountains stopped me dead in my tracks (pun intended).
- Clear offer, followed by a clear CTA. WestJet knows its customers don’t have a lot of time to waste, so their ad gets down to business in 6 words: “Low fares to Calgary,” followed by “Book Now.”
Cirque du Soleil
What’s great about this ad:
- Timeliness. Sometimes the best time to reach a customer is when they’re looking for the last-minute purchase. This limited-time offer does that by advertising on Valentine’s Day.
- A sweet deal. The offer this ad makes is pretty clear, even if you don’t speak French: Two tickets for $169. Plus, a two-for-one special makes sense for the holiday of love.
- Updated imagery. To further drive home its special offer, the image includes a V-Day themed swatch that reads: “Offre de la Saint-Valentin”, or “Valentine’s Day Offer”.
Canva
What’s great about this ad:
- Copy relevant to targeting. The copy of this ad is directly calling out the target audience- business owners who do not have professional design experience but need an easy way to create social content.
- Free trial offer. For SaaS businesses, offering a free trial is a great way to garner signups. By highlighting this, it makes Canva’s offer irresistible.
Go Back To Facebook Ads Examples List
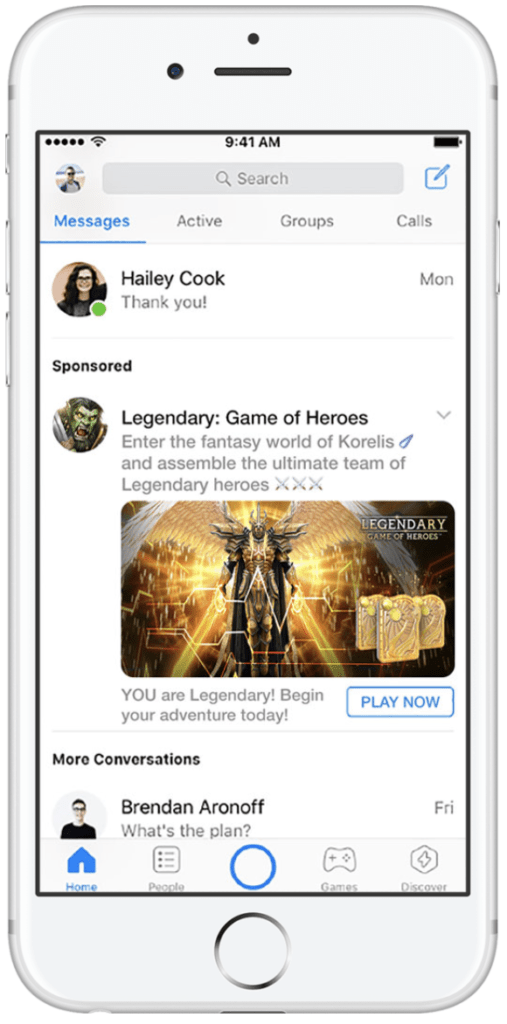
Best Facebook Ads Examples: Messenger Ads
Placement is where it’s at with Messenger ads.
The Facebook Messenger app outpaces Facebook in terms of mobile downloads, so placement in a user’s inbox could translate to more reach.
Available formats include image ads, carousel, and video ads.im
N3TWORK
What’s great about this ad:
- The right place. Their goal was to increase app installs, and Messenger ads were able to find an audience in the right place at the right time: On their phones.
- Tried-and-true. To acquire new users, N3TWORK leveraged creative that had already performed well in the past.
- Punchy CTA. The obvious CTA button choice might have been “Download now,” but N3TWORK leveled up with a “Play now” button. Most mobile gamers understand that to play you’ve got to download.
Go Back To Facebook Ads Examples List
Did you find what you were looking for?
Bookmark this page and check it often! AdEspresso list of Facebook Ads Examples to inspire you will be continuously updated!
Do you want more right now?
Download our FREE eBooks to become a pro and grow your business with Facebook Advertising!
-

The DOs & DON'Ts of Facebook Ads
From Zero to Pro. Learn the best practices to create Facebook Ads campaigns that convert.
-
137 Instagram Ads Examples
Instagram is probably the biggest scaling opportunity for everyone advertising on Facebook...
-
500+ Twitter Ads Examples to get inspired
The best advertisers are those that constantly try new ways to improve their performances...