
Are you struggling with your Instagram marketing strategy and you don’t know why? Or are you a newbie that wants to get off to a good start? Wherever you are in your path, Instagram statistics can help you get the results you deserve.


In this post, we’re going to take a look at the most important Instagram statistics that you need to know in 2020 in order to build your strategies and create your campaigns.
General Instagram Statistics
1. As of January 2020, there are nearly 1 billion monthly active users on Instagram.
1 Billion is a big number, and it positions Instagram behind Facebook (2.8 billion) but ahead of most other social network sites, including Twitter (which has a “reachable” audience of 353 million) and Pinterest (459 million).
You can see the rapid growth dating back from 2013 in the graph from Statista below:


2. 500 million people use Instagram Stories daily.
It’s a high-engaging feature and you don’t want to miss out on it, especially since the same number of people who browse the site daily are also checking out their Stories content.
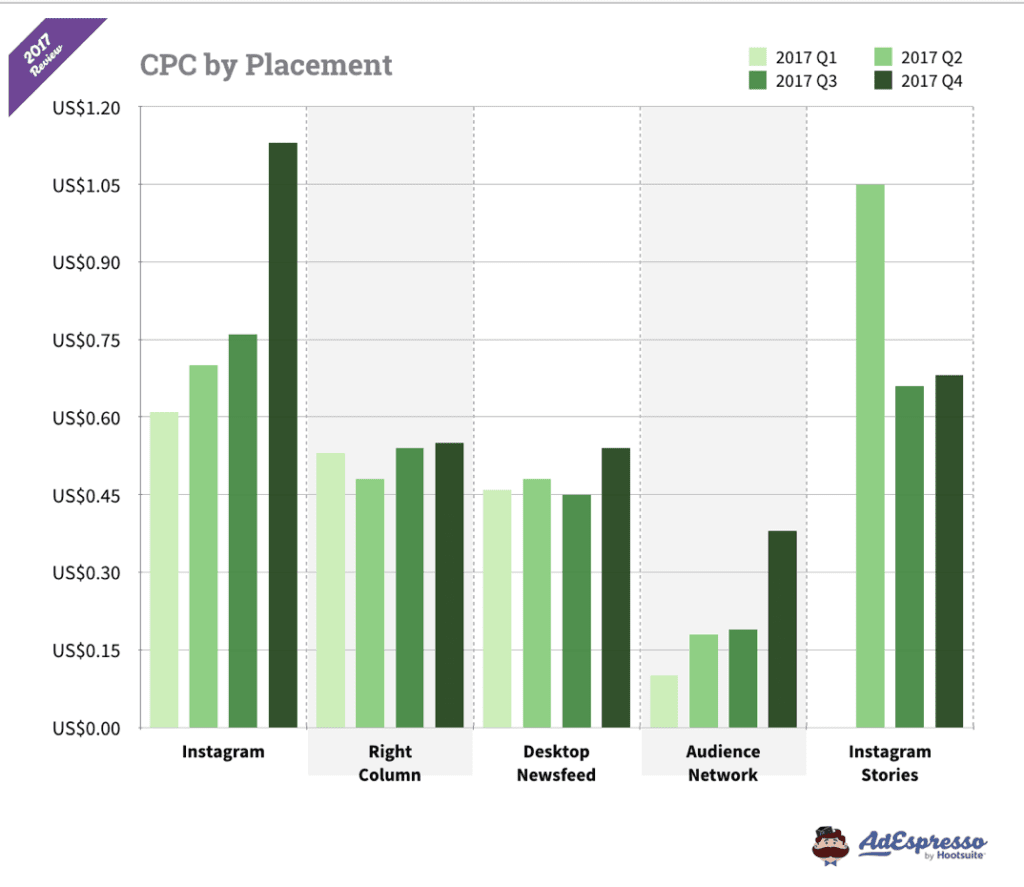
3. Instagram Ads typically cost more than Facebook Ads… but are still worth it
A lot of people shy away from Instagram Ads because the average CPC is higher than it is on Facebook, pretty consistently. You still shouldn’t write them off, though, because engagement rates on Instagram are through the roof.
As long as your audience is on Instagram, you get what you pay for.

4. Instagram advertising has a potential reach of 928.5 million.
While the majority of those 928.5 million likely won’t align with your target audience, that potential reach is so high that it’s almost guaranteed that a significant chunk of your target audience can be found within it.
Instagram User Statistics
5. Some Instagrammers have high levels of disposable income.
As far as I’m concerned, this is the most important demographic information we have for Instagram: a good chunk of them are ready (and able) to open their wallets and bust out the credit cards and spend.
Here’s what they found:
- 31% of people who make more than 75k per year are on Instagram
- 32% of people who make between 50k-74k per year are on Instagram
- 32% of people who bring in 30k to 49k per year are on Instagram.
6. 71% of U.S. adults between the ages of 18-29 are using Instagram.
Right now, this demographic is a hot one that a large number of marketers and brands are clamoring to attract, and with the clear majority of the age group on the platform, the platform gains even more value.
7. 63% of Instagram users check the app at least once per day, and 42% open the app multiple times within the same day.
Most of Instagram’s users are highly engaged and checking in with the app regularly. If you’ve got strong content, you shouldn’t have a problem reaching them consistently. This study found that only 16% open the app once a week or less.
8. As of 2020, 52% of Instagram’s audience identified as female and 48% identified as male.
We know that Instagram has a wide-reaching audience, and numbers say that the app appeals to both men and women pretty evenly.
Some platforms skew heavily towards one generation or another, or one gender predominantly. Reddit, for example, has significantly more male users while Pinterest overall still draws in more women (though this is changing slowly).
9. Approximately 72% of teenagers in the United States use Instagram
This makes the platform the most popular traditional social media site amongst teens.
Instagram is followed closely by Snapchat, which 69% of teenagers use, and Facebook, which is only used by 51% of teens. Since many brands are looking for more reliable ways to connect with younger generations, this is a powerful opportunity.
Instagram Usage Statistics
Instagram is a big engagement powerhouse, and that’s partially because users on Instagram are more willing to engage with brands than they are on other platforms.
These statistics prove that.
10. Over 130 million users engage with shopping posts on a monthly basis.
People are readily engaging with shopping posts (which now includes shopping Stories), proving that this feature is useful in driving both product awareness and sales.
Since users can make purchases natively without ever leaving the app, this is something to test if you’re selling physical, tangible products.
11. Over half of all Instagram accounts browse the Explore section at least once per month.
The Instagram Explore page is the discovery-oriented tab on Instagram where users can view content based on their interests (as determined by algorithm), finding new content created by those that they aren’t already following. Take advantage of this, using relevant hashtags to expand your reach.
12. Average post engagement for business accounts is about .96%, or 1 out of 100 followers.
This doesn’t seem like a lot on its own. I get that. But compare it to the less than 0.1% that Facebook and Twitter see, and it’s looking a whole lot better by comparison. Instagram really is an engagement powerhouse. Remember that 23%?
13. The best time to post on Instagram is 8 AM – 12 PM PST
Well… sort of. This one is complicated, but it’s still important so we want to bring it up.
Best times to post organically do depend heavily on your individual business, your time zone, and the audience you want to reach.
Hootsuite’s social media team analyzed their entire history of posting on Instagram and found that the best time to post was 8AM-12PM PST, or 4-5PM PST on weekdays.


Source: Hootsuite Analytics
14. 81% of users say that they use the platform to research products and services.
If you’re not on Instagram, therefore, you could be missing powerful selling opportunities.
15. In 2020, users spent an average of 30 minutes per day on the platform, which is a 4-minute increase from 2019.
It’s likely that more people staying home due to the COVID-19 pandemic increased growth rates so dramatically.
16. 90% of users follow at least one brand on Instagram.
Most Instagram users follow at least one brand on Instagram; an enormous chunk of those users follow many more. I think I follow around 15 brands, making up around 5% of the total accounts I follow.
17. US Marketers spend about 69% of their influencer budgets on Instagram.
This is significantly more than any other network, making Instagram the most beneficial platform for influencers to be on.
Keep in mind that the second most popular network is YouTube, where brands spend 11% of their influencer budgets.
18. This is clearly effective since 55% of fashion shoppers have made at least one purchase based on an influencer’s post.
Selling features on Instagram that allow you to tag products in your in-feed and Stories content can help with this, giving you incredible visibility. Shopping features can effectively drive sales on platform. You can see how to up Instagram shopping features here.


19. Brands post an average of 27.9x per month.
This means that you should be posting almost every day, potentially skipping out on the days that seem to yield the lowest amounts of reach and engagement.
You have to post consistently to stay relevant, after all.
20. 11 is the magic number for hashtag usage.
If you Google this one, there’s a lot of minority conflicting data, telling people that the ideal hashtag usage is somewhere from 8 to 14.
Several case studies, however, point to 11 as the magic number, showing engagement increasing with each hashtag as you go up to 11 in number, but then declining afterwards.


21. Instagram has the 4th most users of any app.
That’s nothing to ignore, especially since users on average are regularly checking into the platform and engaging with content they enjoy.
22. An estimated 75% of Instagram users will take action on at least one ad at some point.
Don’t rule out campaigns just because the cost is higher if they’re actually driving results and helping you connect with high-value audiences.
For best results, test out different CTAs to see what works for your particular audience, and make sure that you’re split testing in general.
Instagram Stories Statistics
There’s no way around it; you need to be using Stories. Here’s why.
23. 50% of people have made a purchase off-platform after seeing the product or service in Stories.
There’s huge selling potential with this feature alone, especially with Shopping tags now available for Stories.
24. Story Ads increase ad recall, purchase intent, message association, and CTR.
Plenty of case studies back this up, including a Gap campaign that resulted in a 17 point lift in ad recall, a 4 point lift in message association, and a 73% higher CTR than previous Instagram feed campaigns.
25. Mobile-shot Stories ads outperform studio-shot ads a whopping 63% of the time.
Mobile-shot content looks organic and authentic, even though it’s an ad campaign. These images and videos look like UGC, which is partially why they’re so exceptionally effective in Stories Ads. Make sure you’re taking advantage of this.


26. Stories Ads that draw attention to the CTA button drive more results 89% of the time.
All Stories Ads have the option to add a “swipe up to click” button to their content, which you should always take advantage of. When you take time to create designs that intentionally draw attention to the CTA button, you can expect to see more clicks.
Instagram Business Statistics
Facebook Ads still get all the attention, but Instagram placements can clearly hold their own (and more).
27. Instagram business accounts see around 1.46% of growth in monthly followers on average.
Slow and steady wins the race, and remember that momentum is key.
28. 36.2% of B2B decision-makers use Instagram to discover and research new products.
This puts it ahead of LinkedIn, which is notable, and it goes against the conception that Instagram isn’t an effective B2B platform.

29. Business accounts on Instagram post an average of once per day.
That’s a lot of content, so make sure you’re using a social media scheduling and publishing tool (like Hootsuite) to make sure that your content calendar is full!
Back To Top
Final Thoughts on Instagram Statistics
After seeing all of these statistics, you really can’t deny the incredible marketing and selling power that Instagram has.


Now that you know the importance of it, it’s time to learn how to leverage Instagram for your business so you can start applying the knowledge you have.
And the first step we suggest is our Instagram Ads Beginners guide. Click on the image above to learn more!
What do you think? Which statistics surprised you the most? Which were you most excited to see? Share your thoughts and questions in the comments below!