


With Instagram continuing to roll out exciting features and capabilities, marketers have even more room to get creative and gain a competitive edge by using the platform to run ads in 2018.
An example? Some Instagram users can now register a credit card as part of their profile and actually purchase products without clicking out of the app!
The brand-new introduction of this native payments feature has the potential to be revolutionary for bringing even more advertisers onto Instagram’s platform.
So… are you ready to jump on the Instagram ads wagon? Are you planning to allocate more of your budget to Instagram this year? Or are you still in the #MaybeOneDay zone?
Do you wish you had a better way to forecast your Instagram ads spend? Wish granted!
We analyzed almost $ 300M of ad spend to discover the latest trends in Instagram ad costs. This is an incredible resource for when you’re placing bids, setting your budget, and whittling down your target audience in 2018.
- CPC by month steadily increased as the year went on.
- CPC by age typically remained steady within the $.70 to $.80 range.
- CPC is largely higher for females than males.
- Apple devices (first iPhones, then iPads) have the highest CPC.
This illuminating information was from six months of data. Today, we’ve updated our sample size to include another six months.
The results below are now from 12 months and almost $300 million of Instagram ad spend data in 2017, which will give you an excellent reference point to conjecture the costs of advertising on Instagram in 2018!
Keep on reading to refresh some basics and dig into the new stuff!
A Quick Recap on Instagram Ad Bidding
Instagram ads are part of the Facebook advertising network. So, like Facebook ads, Instagram ads are bought through an auction system that determines their price. Each advertiser sets their ad campaign budget (by the day or over the full lifecycle of the campaign) and a bid, which represents the maximum amount they’re willing to spend when a user completes the ad objective.
As of 2018, Instagram broke its ad objectives down into three categories:
- Greater awareness of business, product, app, or service.
- Deeper consideration and understanding of highlighted products or services.
- Conversion from views into sales, mobile downloads, and/or visitors to a physical or online store.
Each of these objectives is measured by three to four metrics:
-
Awareness
- Reach
- Reach and Frequency
- Brand Awareness
- Local Awareness
-
Consideration
- Website Clicks
- Video Views
- Reach and Frequency
-
Conversion
- Website Conversions
- Dynamic Ads on Instagram
- Mobile App Installs
- Mobile App Engagement
As soon as Instagram users are able to view and engage with an ad, the auction process begins.
The auction winner (who pays the minimum requirement) is the ad that creates the most value for users, based on:
- Advertiser bid: How much the advertiser values the result that they have optimized their ad for
- Estimated action rates: How likely a user is to complete the specific action that the ad is optimized for
- Ad quality and relevance: How likely a user is to actually be interested in the ad
For a detailed analysis of how to create high-value Instagram Ads, click here.
Ready to forecast your Instagram ads cost in 2018? Let’s start!
Instagram Ads Cost in 2017 (Full Year Results)
CPC by Country
The location (AKA the Country where you advertise) has an enormous impact on CPC — although it’s less intuitive than you might think!
This is the first time we could analyze CPC by country data (that’s why you only have 2017 Q4) and we discovered that, for example, the U.S. had the third most expensive CPC at $3.56, while Viet Nam and Kenya took the lead with $3.73 and $3.68, respectively.
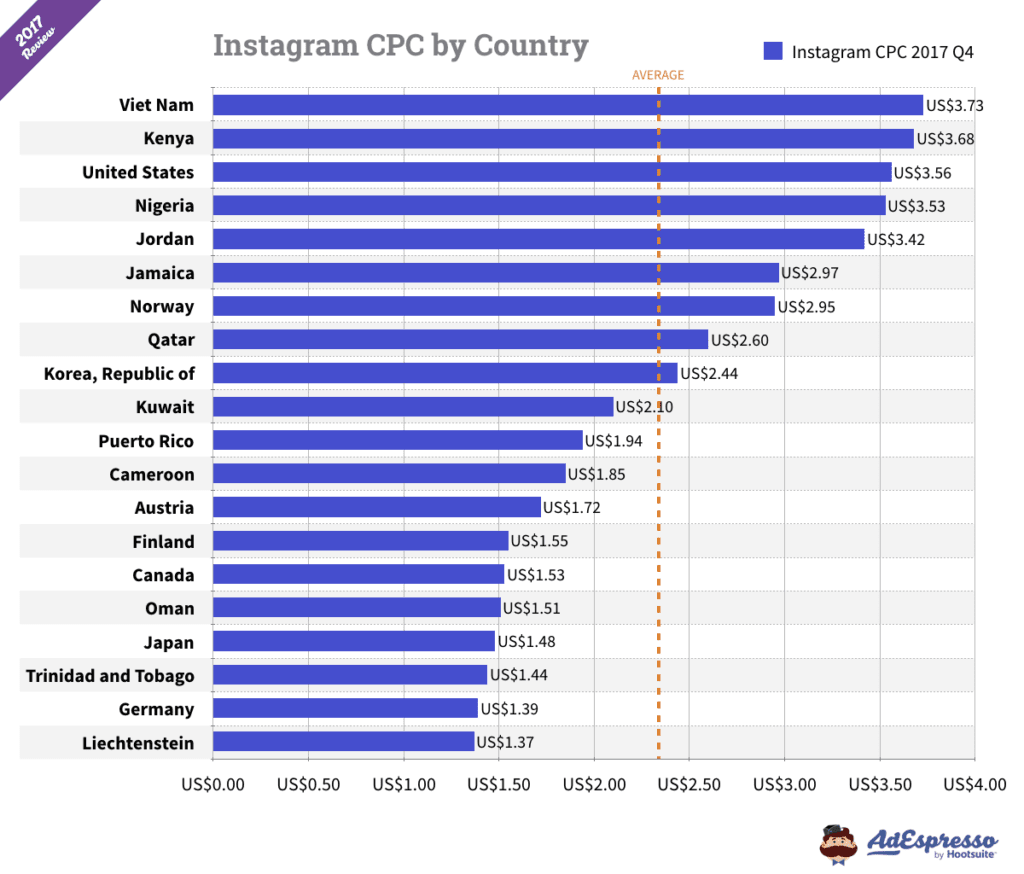

Key takeaway: to cut costs, consider active online shopping audiences in lower CPC nations.
CPC by Age Range
The age range of a target audience will always be one of the most critical factors impacting Instagram ad costs — as well as one of the most strategic. Several studies have been done about GenZ and millennial shoppers as opposed to older generations that have informed complete advertising and design overhauls for companies.
In general CPC across all age brackets increased as the year progressed from Q1-Q4 2017 (with the major exception being users age 13-17, which had a lower CPC in Q3 and Q4 than Q1 and Q2).
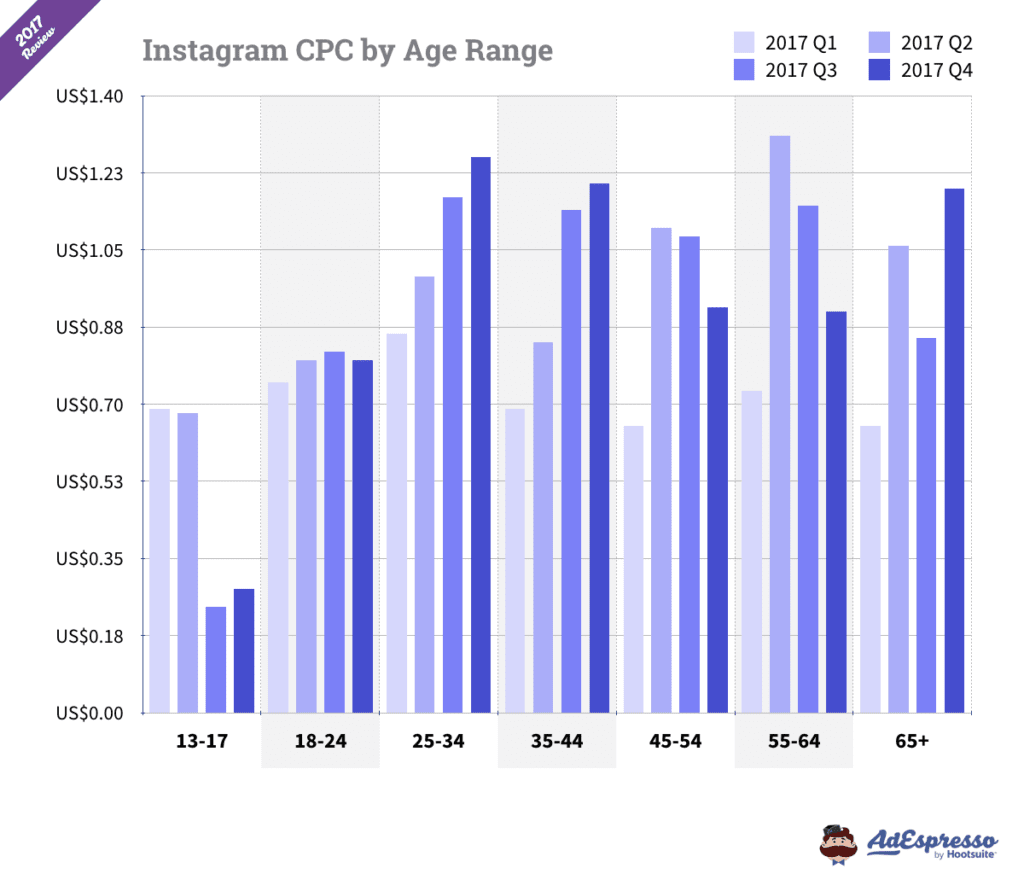
While the runner-up might seem surprising, it could reflect the greater purchasing power of these mature users. Third and fourth place age brackets, 35-44 and 45-54, respectively, weren’t far behind with average 2017 CPCs of $0.97 and $0.94. In last place was the 13-17 age bracket with an average CPC of $0.47.
Key takeaway: don’t discount older shoppers! While it’s important to design ad content that will appeal to the next generation(s), these teenagers and young adults might not be as valuable as their wealthier elders.
CPC by Ad Placement
Where you choose to place your ad — in the user’s main mobile feed, right column, desktop feed, audience network, or Stories bar — also has a strong impact on CPC. Placement is a critical part of optimizing your ads for better reach, particularly as you’re trying to build your brand on social media.
As with age range, CPC increased in all formats as the year progressed. Q4, in particular, saw an enormous CPC spike for right column and desktop news feed placement, correlating with the holiday uptick in e-commerce.
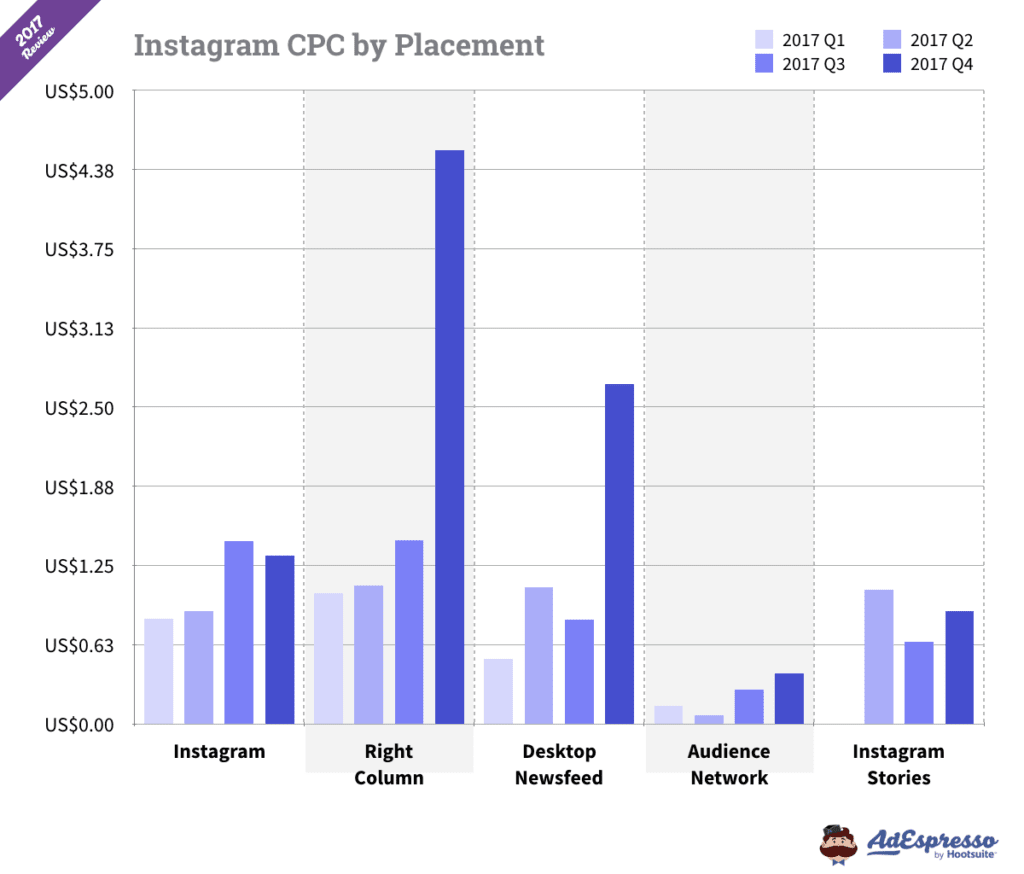
Excluding this outlier, the right column and main mobile feed had similar 2017 average CPCs of approximately $1.20, along with Desktop feed. Audience network brought up the rear with an average 2017 CPC of $0.25.
Key takeaway: placement isn’t as large of a factor as the time of year. In addition, placement in Instagram Stories is still relatively cheap (and yet the format has some of the highest levels of engagement), making Stories one of the most cost-effective ad formats you can select!
CPC by Month
The trend is clear: as the year progresses, CPC increases!
We’ve seen the impact of this above on key variables like country, age range, and particularly placement. Now, it’s all in one place and easy to understand the big surge in Q3 and Q4 over Q1 and Q2.
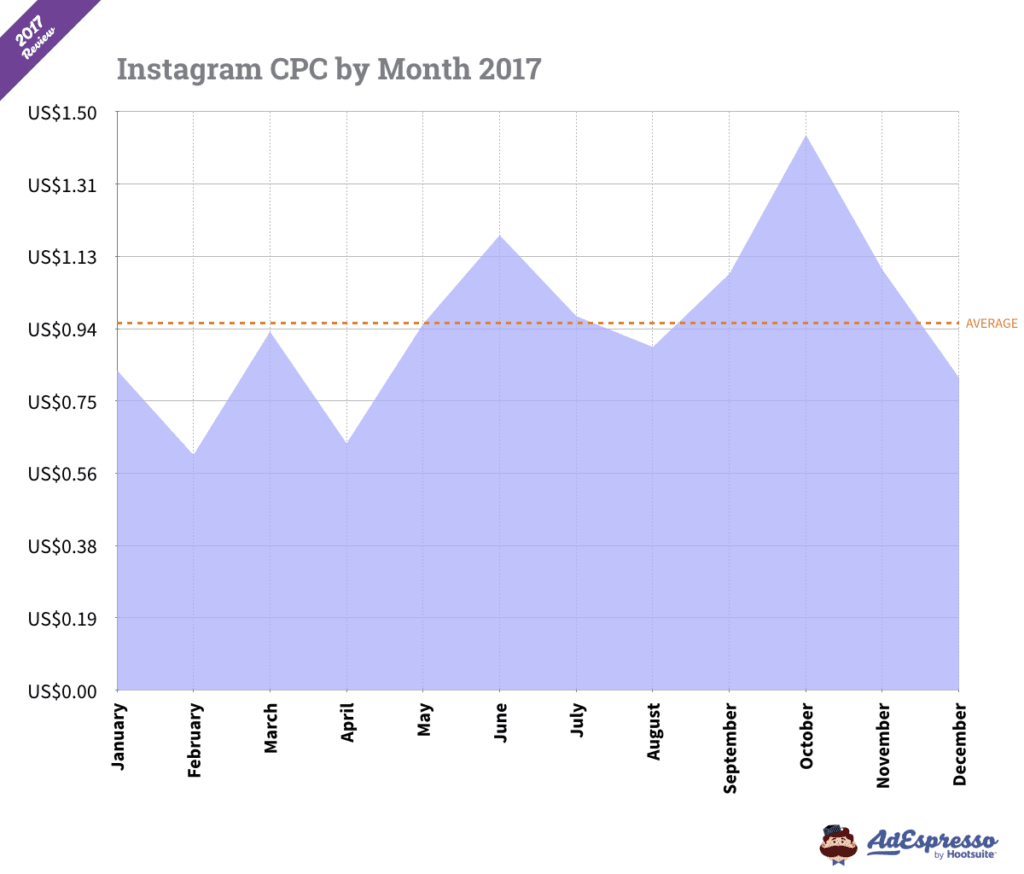
Key takeaway: a sweet spot for ROI during the year is May-July. This could be a great opportunity if you’re a real estate marketer as the best season to sell property falls in Q2.
CPC by Day of the Week
We’ve dug into this topic — the best times to post on Instagram — before.
The refresh of our data supports our previous findings that weekdays see higher levels of engagement (and thus are more expensive).
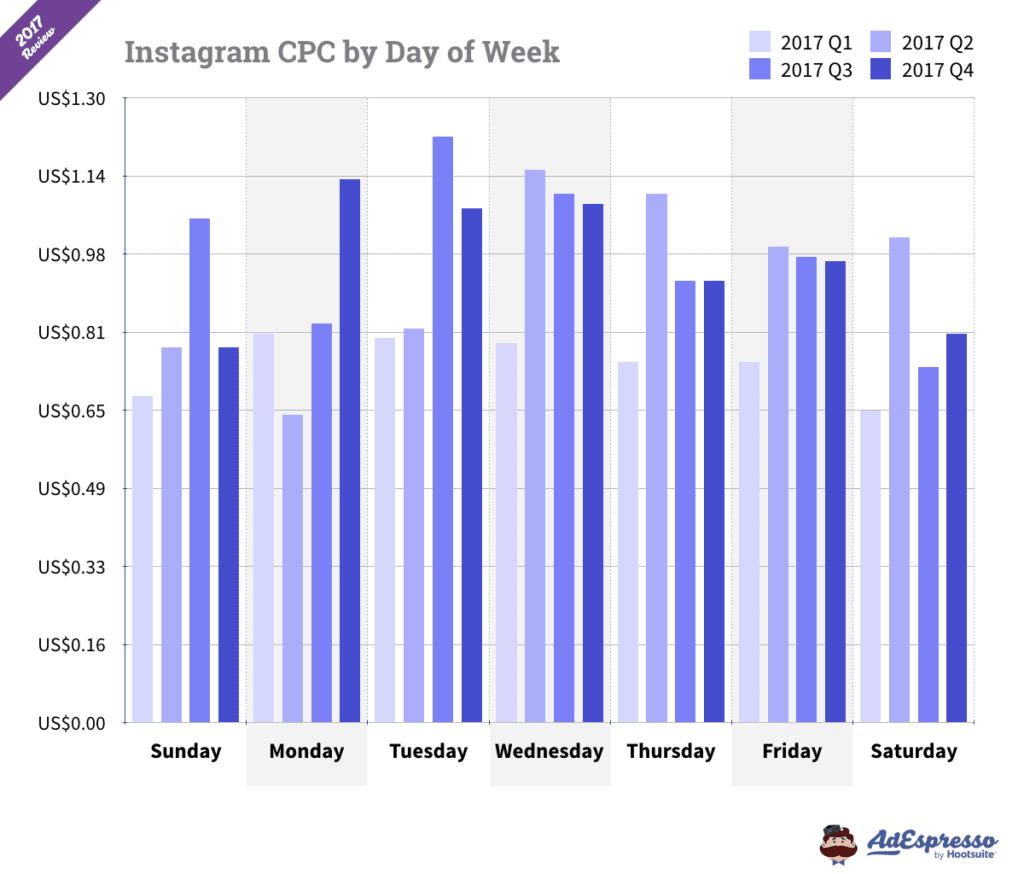
Deciding when to post is always unique to your brand and target audience. For example, if you’re offering executive education courses to corporate executives, you might aim for weekdays even though CPC is relatively high. (Nobody wants to think too much about work on the weekends!)
Key takeaway: balance the higher cost of posting during the week with the potential reward for increased reach and engagement, depending on your company type.
CPC by Gender
More women than men use Instagram. that’s a fact. Or is it?
In 2018 50.7% of Instagram users worldwide were female, while 49.3% were male. It’s not a huge difference (and it’s a narrower margin than the split between female and male users in 2017), but it does impact CPC.
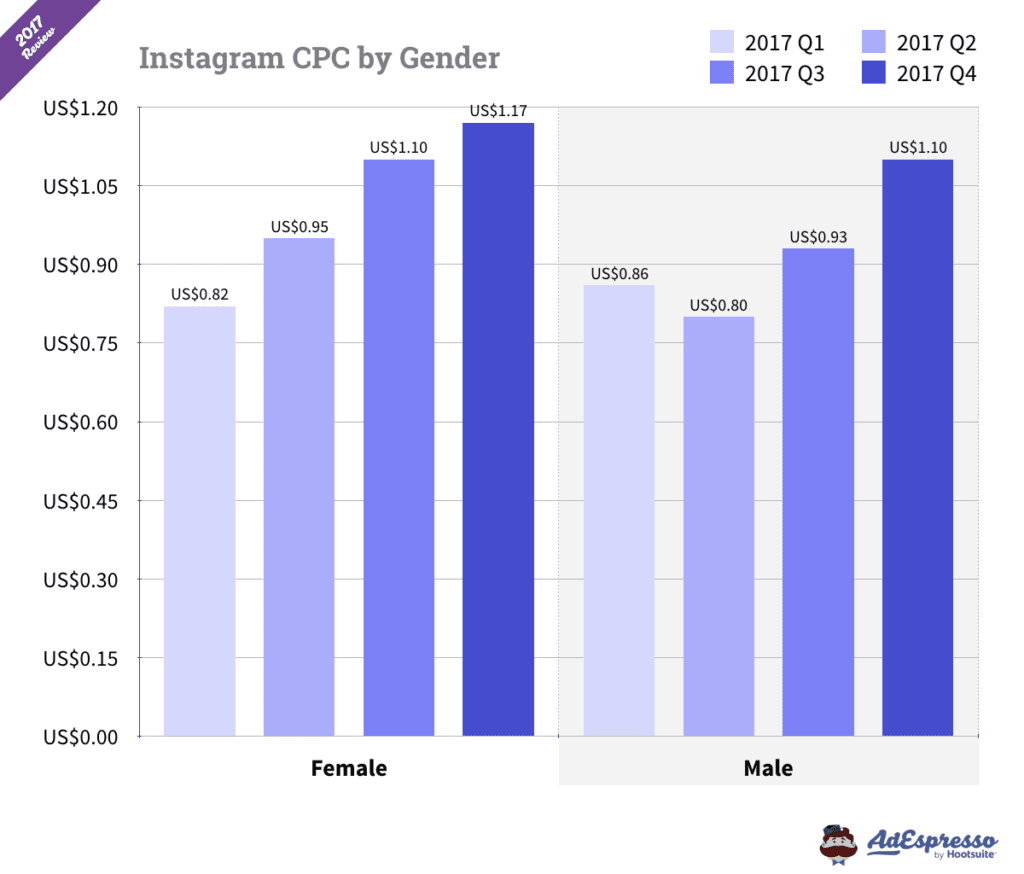
Researchers have hypothesized that the platform attracts more women because it has a “singular focus on appearance” that seems to lure women. The Atlantic even notes that: “Instagram gives you the power to modify your appearance in a way that’s practically on par with makeup and other beauty products.”
What’s been interesting to us is that these traditional conventions seem to be breaking down. In 2018 the split between male and female users was nearly even!
Key takeaway: if you’re worried about an expensive ad campaign that targets women, you might be in for a nice surprise in 2018 as CPC becomes more level between the genders.
Instagram Ad Costs Data Wrap-Up
With an expanded sample size of 12 months of data and a total of $281 million in ad spend, we gained more key findings for readers to take with them into 2018:
- First, don’t discount users over 35 in your targeting. Although they might be more costly to reach, they have more spending power to boost your sales.
- Second, consistent from the first six months of 2017, as the year progresses, CPC increases!
- Third, placing ads between Instagram Stories still has a relatively low CPC compared to the main mobile feed format, keeping the ROI of this highly engaging feature very attractive!
- Fourth, Tuesday and Wednesday have the highest CPCs during the week.
- Finally, CPC remains higher for females than males — but by a narrower margin than in our past survey that noted 58% of users were female and 42% male.
Use This Data to Set Your Own Parameters
Again, every ad campaign will be unique since every marketer has his or her own budget, goals, and constraints.
Although this data is not everything you need to create an optimal Instagram ad campaign, it should give you a reasonable idea of what to expect for 2018 costs, broken down by key categories.
These figures should help you estimate where your ads will fit in with the averages throughout the year and which factors are most relevant to you as you determine how to create the most reward for the least amount of money!
Instagram Ads Cost: The Resource for 2017


The cost of Instagram ads are influenced by many factors — everything from your audience to your ad feedback — so there’s a lot that goes into understanding how to advertise on Instagram.
We’ve analyzed more than 100 million dollars of ad spend in 2017! This provides us with Instagram Ad cost averages for 2017 so far to compare across the quarters.
We’re going to take a look at CPC (cost-per-click) data of Instagram Ads from Q1, Q2, and the beginning of Q3 in 2017. We’ll cover differences based on gender, day of the week, and look at month-by-month breakdowns. Plus, we’ll explain what affects the cost of advertising with Instagram ads.
We might not be able to tell you exactly how much your specific campaign is going to cost, but we’re going to give you a good reference point of the current costs of advertising on Instagram today.
How Does The Instagram Ad Bidding Process Work?
Instagram advertising falls under the umbrella of Facebook’s advertising system, so if you understand how Facebook costs work, a lot of this guide will sound familiar.
Being a part of the Facebook advertising network, Instagram ads are bought through an auction system which determines how much Instagram ads cost. Every advertiser sets a budget, the total amount they’re willing to spend, either daily or over the total campaign, and a bid, the maximum amount they’re willing to spend when a user completes the ad objective.
The auction happens once there is an opportunity for an Instagram user to see an ad, like if a user opens their Instagram app and starts scrolling through their feed. The “bidders” in this auction are all of the ads with the target audience that the user falls under.
Unlike traditional auctions, the winning ad isn’t the highest monetary bidder. Instagram wants to make sure users are having high-quality, relevant experiences, so the auction winner is the ad that creates the most value for users.
This overall value is calculated by combining three factors:
- Advertiser bid: represents how much the advertiser values the result that their ad is optimized for
- Estimated action rates: represents the likelihood of a user completing the action that an ad is optimized for
- Ad quality and relevance: represents the likelihood of a user being interested in seeing your ad
These three factors are combined into a total value for each ad. The ad with the highest value wins and is displayed. The auction winner is charged the minimum amount that was required to win the auction, so advertisers are often charged less for their bid.
Instagram Ads Cost: a 5-Ingredients Mix
If your bid was the only Instagram ad value factor, then the cost of an Instagram ad would be the highest bid, just like with a traditional auction.
But there are two other factors—Estimated Action Rates and the ad Quality/Relevance Score—that are included in the ad Value Formula, so they also determine the cost of the Instagram ad.
Let’s take a closer look at these three factors, as well as a few other conditions that can influence the estimated action rates and ad quality/relevance score, to understand what can affect Instagram ad cost.
1. Your bid
Because advertisers acquire Instagram ads through an auction system, they have to bid for each ad. Advertisers can choose to set their bid as manual or automatic:
- Manual bid: The advertiser selects a maximum amount that they’re willing to spend to achieve the selected ad result (ex: $5 for a click).
- Automatic bid: Instead of the advertiser selecting the bid amount per ad result, Facebook chooses how to spend your entire ad budget to optimize for your ad result. This option is recommended for users who are unsure of how much they should bid.


[Source]
It’s true that an advertiser could make their ad cost lower by placing a low manual bid, but that comes at the risk of having your ad show less frequently, losing out to other ads with higher bids.In any case, users shouldn’t worry too much about placing high bids since you’re only charged the minimum amount needed to win the auction if you’re the winning ad.
2. Estimated action rates
When Facebook advertising is deciding whether to display your Instagram ad to a user, they consider their measured estimated action rate for your ad, which indicates how likely they think the user will complete your optimized ad action (such as a link click).
The estimated action rate is measured by considering the past actions of the user you’re trying to reach, and the Instagram ad’s historical performance data.
For example, if you are releasing an Instagram ad that’s optimized for clicks to your website, the estimated action rate might be calculated by considering how many website conversions your ad has received so far and whether the user has clicked on Instagram ads for websites like yours.
Depending on your selected bidding type, estimated action rates can directly impact Instagram ad costs.
If your ad scores a low estimated action rate with a user and you’ve selected automatic bidding, a higher bid (within your ad budget) will be placed to increase your chances of winning. For users who opt for manual bidding, having a low estimated action rate ad could just mean less ad exposure depending on whether their bid amount is high enough to compete.
3. Ad quality and relevance
The ad quality and relevance value factor represents how interested Instagram expects a user will be in your Instagram ad. It’s calculated by considering three factors:
- negative feedback — a score based on the number of times users hide your ad or choose not to see it
- positive feedback — a score based on whether people are expected to complete your ad objective (ex: click on a link)
- users’ past Instagram activity — considers whether they have a demonstrated interest in what you’re advertising
The more positive your ad feedback, the higher your ad quality and relevance score is (and vice versa). Likewise, if a user has a history of being interested in what you’re advertising, then that will increase its ad quality and relevance score.
Advertisers can easily gain a sense of their Instagram ad’s quality and relevance by going on theFacebook Ad Manager, selecting the ad they want to view, and checking its positive feedback, negative feedback and relevance scores.


Just like with estimated action rates, an Instagram ad’s quality and relevance score can impact the ad’s cost depending on your bidding type. For automatic bidding, higher bids will be placed by Instagram if the ad quality and relevance score isn’t as high as competitors. With manual bidding, a low ad quality and relevance score could result in less ad exposure if the placed bid isn’t high enough.
4. Your audience targeting
If there are many brands that are targeting the same audience you’re targeting, the competition to be the winning Instagram ad with the most value is going to be high. With this competition, audience targeting impacts Instagram ad cost.
Typically, ads with popular target audiences are going to cost more. If there are a lot of ads targeting the same audience, there’s a good chance that many of these ads will have similar estimated action rates and ad quality/relevance scores, meaning that the ads will need higher bids to have the most value.


[Source]
It’s important to note that Instagram ads are in competition with any company that is trying to reach the targeted user, not just brands within their industry. People typically have a wide variety of interests, so they are going to belong to target audiences of many brands.
Pro Tip: While advertisers ideally want to pay as little for their ads as possible, you don’t want to pick a less popular target audience to save money. Instagram ad conversions are all about targeting the right audience, so there’s not much you can do if your target audience happens to be a popular one.
5. Time of year
We just covered how the cost of an Instagram ad can increase if its audience is being targeted by a lot of brands. One reason a bunch of brands might start targeting audiences is that it’s a peak time of year.
Advertisers know that Instagram will get more traffic during times like the holidays or the Super Bowl, so they’re going to put more effort into reaching their target audiences.


[Source]
Black Friday and Christmas are obviously going to be competitive days for advertisers, but other holidays to keep in mind for popular sales are Labor Day, New Years, and Cyber Monday.Like other advertising platforms, Instagram has a ton of traffic on holidays, making investing in an ad during peak times potentially worth it. If you’re considering Instagram advertising during a busy time, just be sure to keep in mind that costs will be higher.
How do Bidding Options Affect Instagram Ads Cost?
There are two bidding options that determine how you will be charged for your Instagram ad — by CPC or CPM.
- Cost per click (CPC): You are paying for the number of users who click on your ad. It’s important to note that you are paying just for the click, not for a completed conversion.
- Impressions (CPM): You are paying for every thousand impressions that your ad receives.


[Source]
Each of these payment options is tied to an ad optimization option, which directs Instagram to send your ad to users who will complete your requested action. Here are the optimization options:
- Conversions: Your ad will be sent to users who are most likely to complete your set Instagram ad objective. With this option, advertisers pay by CPM.
- Impressions: Your ad will be shown to as many people as possible, and you pay by CPM.
- Clicks: Your ad will be shown to the users who are most likely to click on your ad, and you pay by CPC.
- Daily unique reach: Your ad will be delivered to users up to once a day, and you pay by CPM.
Based on your ad objective, optimization options are automatically recommended for your ad.


[Source]
An ad’s optimization option can affect the ad’s cost because it determines who will see the ad. If these people don’t complete the objective action you’ve set for the ad, the ad’s estimated action rate and relevance scores will decrease, causing the ad’s cost to increase. Advertisers want to make sure that they pick an optimization option that’s appropriate for their ad and will keep its value high.
And now, the answer you are waiting for!
How Much Instagram Ads Cost in Q1 and Q2 of 2017?
Now that we’ve got a clear idea of how the bidding system works and what factors currently are most heavily affecting the cost of our Instagram Ads, let’s take a look at the data.
This data was based on over $100 million of ad spend pulled from all AdEspresso users from Q1, Q2, and July of Q3 in 2017. All currencies have been converted to USD in this data.
While all the data and numbers in this post are coming off real campaigns, you should be using these numbers only as a reference or a guideline.
There are too many factors influencing Instagram ads cost to know exactly what the cost will be for you. The only way to know that is to run a few of your own campaigns. Still, this data can provide a powerful point of reference and more concretely give a rough answer to the question “How much do Instagram Ads cost?” that doesn’t involve a shrug of the shoulders.
When breaking down the numbers in our research, we looked at how different factors like the age and gender of users affected how much they were spending. This data reflects the average cost per click for multiple variables for Q1, Q2 and the beginning of Q3 for 2017. The currency is in dollars.
Here’s what we found…
CPC by day – worldwide


Overall, the CPC was highest on the weekends. Tuesdays had the lowest CPC, particularly in Q1. CPC increased for every day of the week in Q2, with weekends experiencing the biggest spike.
CPC by month – worldwide


CPC experienced a slight bump from February to March. Overall, it looks like Instagram ads have been getting more expensive over the course of the year.
Median of CPC by quarter


The CPC median increased with each quarter, particularly from Q1 to Q2.
CPC by age – worldwide


The highest CPC age groups are 18-24, 25-34, and 35-44 year olds, which makes sense since these are Instagram’s most valuable age demographics. According to a Pew Research center report, 78% of Instagram’s users fall between the ages of 18 and 49.
CPC by Gender – Worldwide


The CPC for women is significantly higher than for men. There are more women than men using Instagram — 58% of users are female and 42% are male. Because there are more female users, women are going to be a more popular target audience than men, driving up the CPC for women.
CPC by device – worldwide

Apple leads with iPhones having the highest CPC and iPads the second highest.
CPC by female age – worldwide

The female CPC is highest for 18-34 year olds. Other than 13/17 year-olds, every age group increased in CPC by quarter.
CPC by male age – worldwide

There is a CPC spike for the 13-17 year old males in Q2. Otherwise, the CPC for males is pretty consistent in the 18-44 year old age range.
Instagram Ads Cost Data Wrap-Up
For a quick summary of 2017 so far, and to help us all notice a few interesting trends, we found (on average) that:
-
The CPC increased as the year went on. The CPC by month steadily climbs as the year goes on.
-
The CPC by age doesn’t vary too much. Other than the Q3 results (which only include July), the CPC by age typically falls within the $.70 to $.80 range.
-
Typically, CPC is higher for females than males. The female CPC was slightly lower than the male CPC in the first quarter, but it was much higher than the male CPC in the second and third quarter.
-
Apple devices have the highest CPC. iPhones have the highest CPC, and iPads have the second highest.
And there you have it…
There’s no single answer to the question, “How much is my Instagram ad going to cost?” There are so many factors – audience targeting, bidding type, ad quality – that affect how much marketers will pay for their Instagram ad, so costs are going to vary.
Still, you can start developing a sense of what your Instagram ad is going to cost by considering how the factors that we’ve mentioned in this guide might increase or decrease the price of your ad.
Familiarizing yourself with our provided 2017 data about CPC for Instagram ads will also give you an idea of the costs to expect when launching an ad campaign.
Knowing what factors can impact the cost of your Instagram ads and Instagram ad cost data are only meant to be reference points, not exact predictors of what your ads will cost. Still, these reference points are valuable resources, equipping marketers with clear cost range expectations for their Instagram ad campaigns instead of going in empty-handed.
What do you think? Do your Instagram ad costs line up with our data? Leave us a comment and let us know!