
You’re data driven. You make decisions based on numbers. Results. Not pie-in-the-sky feeling and intuition. No HiPPOs allowed.
There’s only one problem. What if those numbers you’re referring to are wrong?
What if the stuff inside Google Analytics – the historical performance information that you’re relying upon in order to create future strategies and tactics – is only telling you half the truth?
Because unfortunately, that’s what’s happening.

You think you’re seeing one thing. But there’s a whole lotta stuff that’s (a) flat out incorrect or (b) misleading and misinforming.
Crushing, right? Like being told the first time there was no Santa Claus. (Don’t worry kids, there is.)
Don’t worry, though. Because if you know where to look, there’s a few simple tweaks you can make in order to get the truth (and nothing but the full truth) from your analytics.
Here’s 7 little-white analytics lies to look for and how you can fix them ASAP.
Lie #1. Secure Search Obfuscation
In January, Google announced that all websites without SSL certificates would receive a brand spanking new warning inside Chrome.


That means right now, if you don’t have an SSL certificate setup on your website, people are going to be actively warned away by Google.
WTF Google?! I thought we were friends? How you gonna play a homie like dat?!
Why would Google make such a proactive, aggressive move?
Because cyber crime ain’t no joke, that’s why!
It’s up over three times since a year ago. And expected to top two trillion bucks in just a few more. HTTPS and SSL certificates help protect your user’s information from the myriad of hacking attempts that occur daily in coffee shops, airports, or hotel WiFi networks.
(So if you haven’t already, see if your hosting provider already integrates with Let’s Encrypt and if not, buy an SSL certificate from your domain registrar ASAP.)
In a way, this is simply a continuation of secure search. You know, that secure search.
The one that stripped away all your keyword data? Leaving you with a lump of [not provided] to show for your troubles? The one that makes you instead pay more on AdWords just to recover that data that should already be yours? (Thanks again, Goog.)
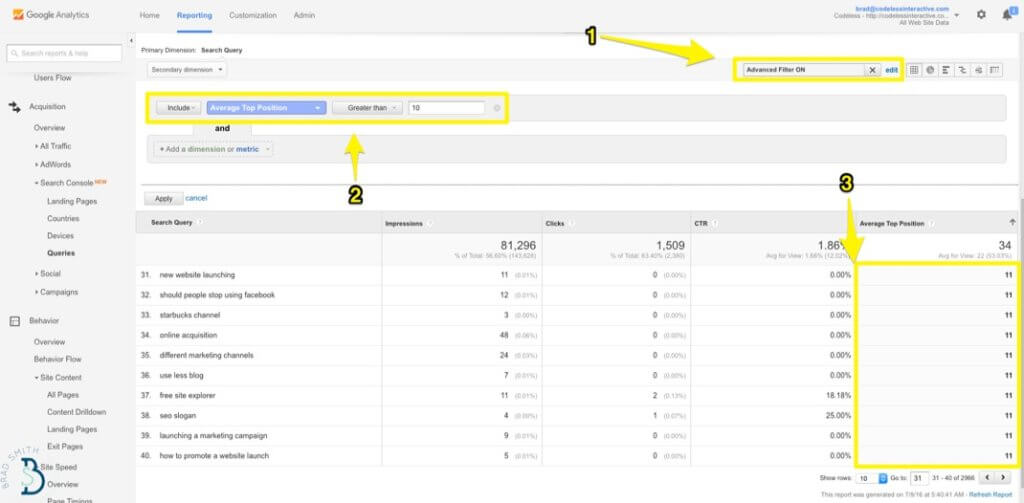
You can kinda, sorta figure out how peeps are getting to your site. Go under Acquisition > Search Console > Queries for a brief (and I mean brief) snapshot:

But. What should you do if you want a complete, accurate view? After all, how do you know what SEO decisions to make or new content to produce without that info?!
Reframe the problem.
Instead of keywords, start with pages. Like, the ones currently receiving the most traffic from organic search.
Find Popular Content (under Behavior) and then add a Medium to the picture. Example:


Next, fire up good old Search Console (formerly Webmaster Tools) and look at the queries sending you the most clicks.


Ok. Not perfect. But it’s a start. And it gets you a little closer to wrapping your head around which content is performing best.
Except. There’s only one problem. Your traffic source data is also wrong.
Lie #2. Direct Traffic Isn’t Direct
We all owe Groupon one giant, big, collective Thank You.
Here’s why.
Years ago, they de-indexed themselves. From Google. For a day. They willingly put their neck on the line in order to help us understand how search traffic was being (incorrectly) categorized.
The problem is referrer data.
Many times, your analytics package (like Google Analytics) can’t see it properly. One classic example is Microsoft Outlook. It’s a desktop app, and if you don’t properly tag email campaign links, someone visiting from their won’t be picked up properly. So they’ll show up as a Direct visit instead of an Email / Referral one.
Same thing is happening to your organic search (or SEO) traffic as well. And Groupon proved it.
They analyzed traffic for their too-long-to-remember URLs (because no one would type these in directly) during this de-indexation and saw Direct traffic fall by 60%.


That means the 60% Direct traffic decrease wasn’t actually Direct traffic at all, but organic search traffic.
Great. Thanks for the SEO history lesson. What’s the point?
Guess what’s happening to your Facebook data? You think it’s any different?
‘Specially all that top and middle of the funnel stuff that may not result in a hard conversion.
And that becomes especially problematic when you try to piece together the clues to arrive at an individual customer value (which we’ll see later on).
Lie #3. Direct Phone Calls Also Aren’t Direct
Millennials don’t make phone calls.
But they’re alone in this case.
Because phone calls are where the money’s at for most companies.
Compare conversion rates. A puny 1-2% online. A whopping 30-50% over the phone.
Here’s the problem.
In most companies, phone calls just show up. Just like that. Out of the blue.
They get chalked up to “great brand awareness” or “word of mouth”. When in reality, it’s anything but. HiPPOs pat themselves on the back. And the digital marketers get the stink eye because their ad data barely shows any registered phone calls.
But here’s the thing.
Guess where those phone calls are coming from? Guess how people are finding them? Same place people find other information today. Online.
Invoca’s study (of over 30 million phone calls) concluded that 70% come from digital channels. Which should come as… absolutely no surprise to most digital marketers.
The problem, of course, is always the same thing: proving it.
Thankfully, that’s getting easier.
One favorite method is CallRail’s Dynamic Keyword feature. You create a pool of available numbers that automatically get paired with each new visitor. The actual, referring phone number on your site then gets replaced by this unique session’s number. And it tracks them from page to page.
So that when they do finally dial in the number they’re looking at, you can collect and sync the original traffic source that generated the phone call.
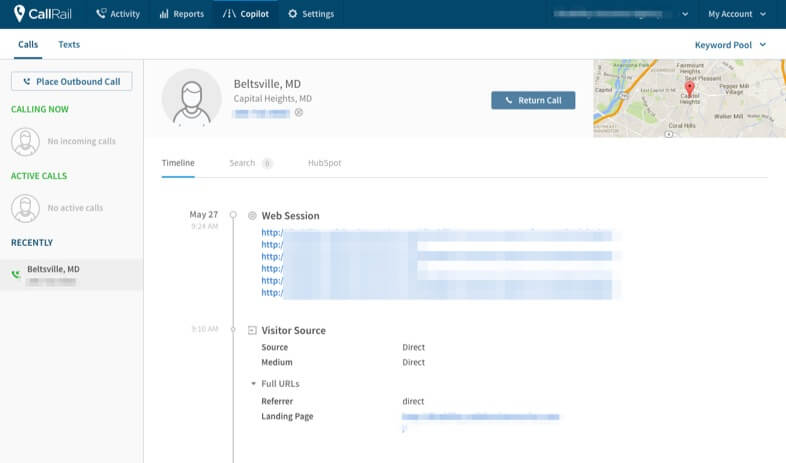

Awesomely, you get that person’s location. The landing page they came to your site on. And all of the pages viewed during that entire session.
You can even merge this data with a CRM to get a more accurate, complete picture of one customer’s journey. (But let’s not get ahead of ourselves. More on that later.)
Lie #4. Last Touch Attribution Bias
A landmark report years ago from the highly reputable Forrester Research annouced the following finding:
“Social tactics are not meaningful sales drivers.”
Yikes. Apparently subtly isn’t a Forrester specialty.
The exact results from over 77,000 eCommerce results showed that only a measly 1% resulted from social media.
Instead, Search (both organic and paid) performed best for new customers. While Email was king for repeat ones.
Which, again, should come as no surprise if you’ve been doing this for awhile.
You mean to tell me, that Search – you know, when people type in exactly what they’re looking for – turns into purchases quickly? And that Email – which contains all of your happy past customers – also converts well for repeat purchases?
No freaking duh.
You login to Google Analytics. Look up Conversions by Source. And that’s what you see.
But that’s not the full picture.
Because in some almost every single case, you’re only taking last touch attribution into account. In other words, the traffic source that gets the credit is the very last one used prior to purchase.
(Yes. I know they have other attribution models. But, as a show of hands, how many companies do you think actually set up some sophisticated, Avinash Kaushik-esque attribution modeling? I’d venture to guess one out of 10 on the high end.)
The problem is that it takes like a dozen ‘touches’ before someone buys. And they hop around from device to device and channel to channel during that time.
So in most cases you’re not seeing all of those interactions. You’re not seeing what sent people to your site originally. How the found your brand or built up enough trust to eventually come back and convert.
Which means all that hard work you’ve done to get content promoted on Facebook to build an audience and then ad campaigns to generate leads to round out the middle of the funnel once again, gets neglected. Or overlooked.
Another problem is that Google Analytics actually doesn’t want you tracking this information, either. For, what else: privacy. (Right. Like Google cares about your privacy.)
You can track User IDs. But not any personally identifiable information (you know, the stuff you need like actual names and email addresses). OR else:
“Your Analytics account could be terminated and your data destroyed if you use any of this information.”
Instead, here’s what happens:
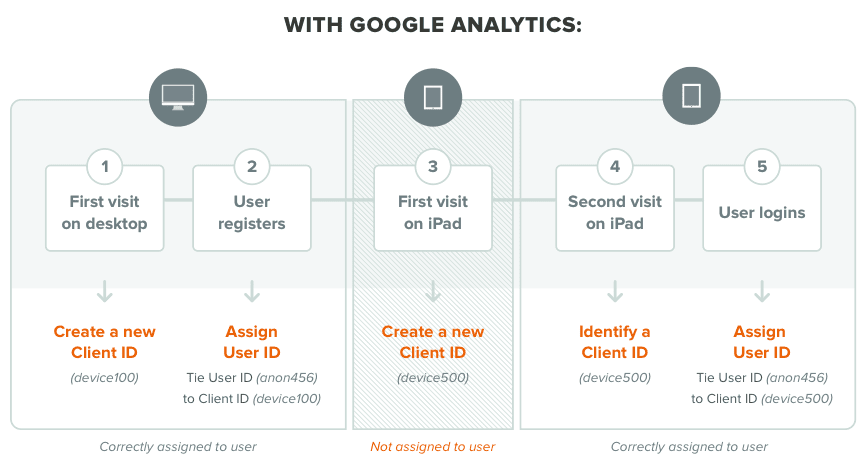

So once again, not very helpful.
Because you see 10 conversions in aggregate from Organic Search. Even though the actual number or commision or customer LTV is lost. And it actually started from a Facebook campaigns you ran three weeks ago.
Speaking of…
Lie #5. No Campaign Visibility
A client’s analytics account is a scary sight.
Conversion tracking is picking up page views instead of actual submissions. They’re using Excel to piece together information. And nothing else integrates with their internal CRM. (Which was probably created in the nineties.)
All of this is YOUR problem now.
Because for reasons we’ve already discussed ad nauseum, if you can’t draw a nice, simple, straight line from your work to revenue, you don’t get any of the credit.
And if you can’t track results, or even leading indicators like clicks and CPC, you won’t have any idea of how to change and tweak and iterate on your ad campaigns.
Obvious workaround #1 would include UTM parameters.
Tag each and every last thing you can possibly get your hands on before it goes out the door.
![]()

But that’s table stakes. And sometimes it’s not enough.
Workaround #2 includes inbound traffic segmentation.
You create dedicated landing pages for each channel and then make sure the link only shows up in that appropriate channel (no-indexing the duplicate page variations, etc.).
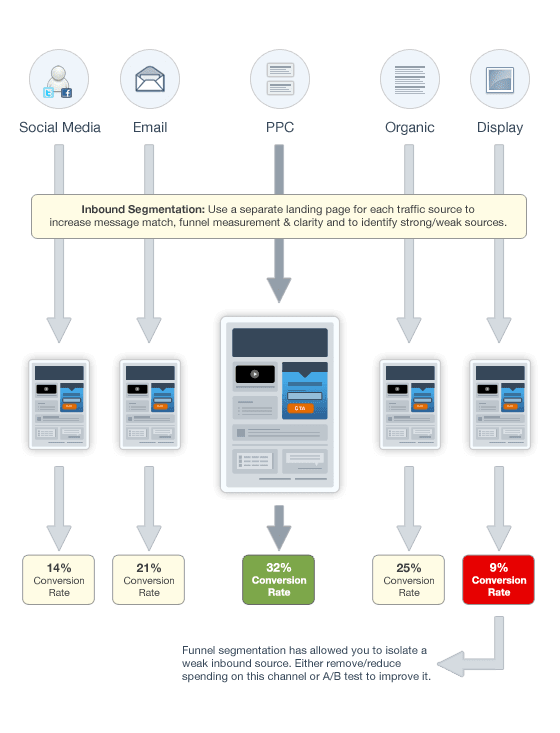

You can also layer in other analytics tools, like the Kissmetrics funnel report, to piece together those individual clues you just setup.


Now, even if your client’s analytics account is an absolute nightmare, you’ve largely sidestepped the issue and are tracking all of your campaign results in other third-party solutions to prove your mettle and take back the results that are rightfully yours.
Lie #6. False Positives A/B Tests
A/B tests can be largely a waste of time.
No matter how many times you see it mentioned on incestuous growth hacking posts that talk about growth hacking on Growth Hackers.
They’re very high effort, low reward. The chances of huge success are slim. And you’re going to need a minimum of 1000 monthly conversions with 250 per test to see anything that starts to resemble statistical significance.
In other words, there’s a high implicit opportunity cost that’s not always worth your time.
But that’s not even the worst part.
The main problem with A/B tests is that you can sometimes lie to yourself. So the A/B result you see misleading and a false positive.
The up-and-to-the-right graph looks great. But the results on your P&L doesn’t.
Case in point: friction.
Reduce friction, by removing form fields for example, and you’ll generally see better results.
Another example includes asking for a credit card upon signup. Don’t ask, and your conversion rate should increase. Ask, and it goes down. (Totango once say a 10% to 2% drop.)
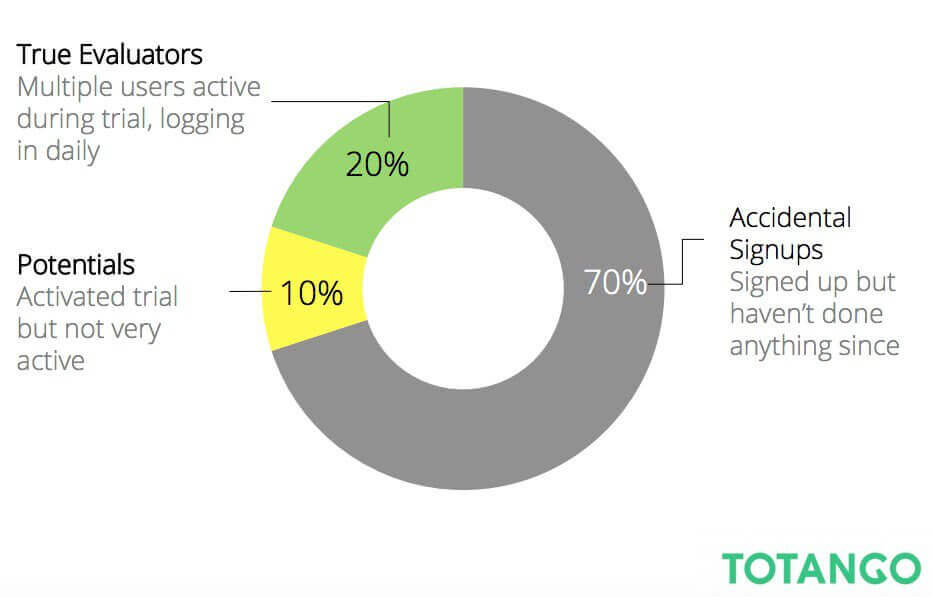

Software company Moz also saw this first-hand, after discovering that their highest LTV customers visited more than eight times before converting (and not the ones who converted on the first or second visit like you’d assume).
Point is: If you’re letting more people in the door… but those people are lower quality (up to 70% of free trials are useless)… is that positive A/B test really a good idea?
Maybe. Maybe not. But unless you’re taking into account the entire funnel and watching how those changes near the top impact results down at the bottom, you really don’t know if it was a ‘success’ or not.
Which brings us to our last lie.
Lie #7. Over-Emphasizing Leads (And Not Sales)
Analytics data, in aggregate, is (1) not very actionable and (2) can be wrong or misleading.
See: Lies #1-6.
It’s only when we can layer specific customer data over this data that we can begin to glean any insight.
Examples?
One campaign drives ten leads. The second only five. And… who cares?
Literally, doesn’t mean anything. Yet.
1. How many closed sales come from each?
Maybe they deliver the same number of closed customers despite the difference in total leads generated. Which means your efficiency (conversion rate) on ad spend might be much higher on the second campaign (decreased cost per lead).
2. Now. What are those closed customers worth?
Maybe the first campaign did deliver more closed customers after all. But if the second campaign’s customers are worth 1.5X… once again, things change.
3. OR. What about LTV of each customer?
Look:
Everything is becoming commoditized. Everything. That drives prices down overall as increased competition and alternatives continue to flood the marketplace.
Don’t buy it?
What’s the cost of a WordPress theme today? Hell – even the cost of completely custom web design (on basic web sites) is dropping precipitously because (1) more web designers than ever before, (2) 99Designs, (3) Themeforest, and even (4) Squarespace or (5) Wix.
Which means overall, the price you can charge for a basic portfolio site or B2B content-driven site isn’t climbing but falling.
The true path to prosperity isn’t a single conversion then. Definitely not a single purchase. But many over time from the same people.
And the only way you can get this stuff is if your marketing analytics merges with your point of sale and/or accounting data.
Here’s why:
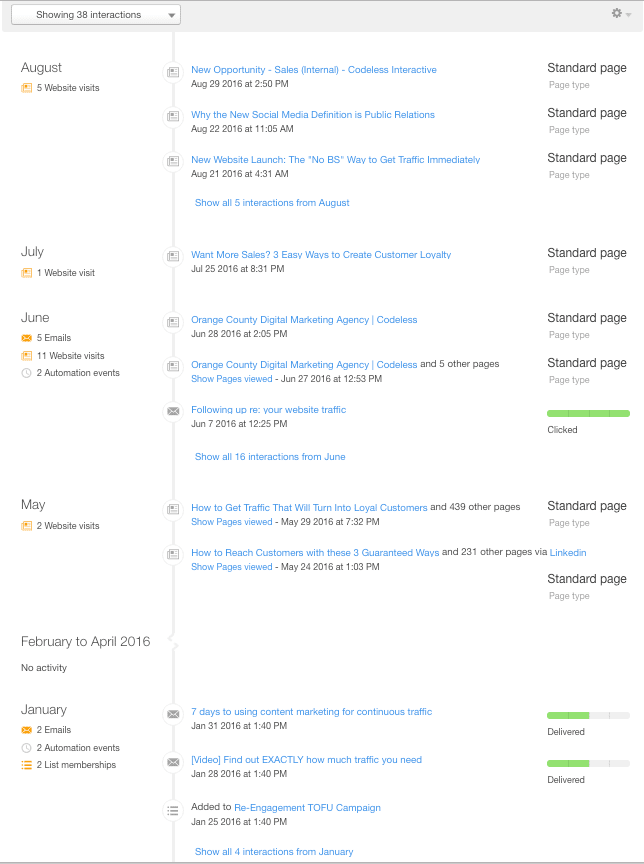

This individual visited my company’s site literally dozens of times over ~nine months (and maybe more) before becoming a new opportunity in August. I know his name. I know everything about him. And I know how much he’s paying over time.
Now you can go back through this digital trail. You can see what campaigns or events triggered the initial phone call or the eventual opt-in form submission. And you can make better marketing decisions that produce more events just like it.
Conclusion
Analytics aren’t just raw data.
They tell a story. They paint a picture.
But analytics don’t always give away the full picture.
We’ve picked on Google Analytics repeatedly here, but they’re just one of many where these same problems pop up.
These programs don’t get the information they need in order to properly organize or categorize everything. And as a result, we marketers also don’t get what we need to make better strategies and recommendations.
There’s no cause to panic. You just need to proceed with caution.
Statistics lie. Data lies.
Figure out how to spot those lies in order to discover the truth. And what you should do based on that truth.