
Let’s be real: Creating social media reports can be boring, tiresome, strenuous—you get it. But it’s very important.
Why?
Because, in social media marketing, you can only understand the results of your efforts if you track and analyze your performance. It’s also the only way you can prove to your boss and team members that your work contributes to the growth of the organization.
Building a social media report can also help you learn what’s working and what’s not, so that can tweak your strategy accordingly.


In this post, we go over how to track all of your most important social media performance metrics, and how to build easy-to-follow, comprehensive reports that will show your team and other stakeholders the value of your strategy.
We’ve even included a free, customizable social media report template you can use to get a head start!
What is a social media report?
A social media report is a document that details the performance of your social media networks over a period of time. It includes relevant performance data like reach, engagement, and conversions.
Your social media analytics report can be anything from a simple spreadsheet to a data-packed slide presentation. The format your report takes depends on your audience and the purpose you want it to serve.
Different audiences might require different reports. For instance, if you’re making the report just for yourself, you can use a simple spreadsheet. But if you work in a marketing agency, you’ll need to create a more in-depth report to show clients the results and ROI from your work.
What should your social media report include?
Your social media report should contain only the data your audience needs to understand your social media performance. That means there shouldn’t be unnecessary details or vanity metrics in your report. Your report should look clean and easy to understand.
We have outlined below some things you should feature in your social media report. But none of this is set in stone.
Feel free to switch up the sections to create the best social media marketing report for your audience and needs.
A brief outline of your social media strategy
Start off your report with an overview of your social media marketing strategy. This will help your audience understand the importance of the other elements you’ll include in the report.
There’s no need to go overboard on this section. Just lay out the overall purpose of your social media marketing efforts and how they align with business goals. For example, if your company uses social media primarily to increase brand awareness or to sell products, include that in your report.
You should also include any changes you’ve made to your strategy since your last report. Include any new channels you’re actively working on and the ones you’ve dropped.
Your goals
This is where it gets a bit technical. Here, you’ll take the brief overview you wrote in the previous section and break it down into SMART goals.
For reference, SMART means Specific, Measurable, Achievable, Relevant, and Time-bound.
This goal-setting framework will help you create goals that you can track easily and report. The number of goals you outline in your report will vary depending on the size of your team, the company you’re working for, and the depth of your social media strategy.
If this is your first social media reporting report, just outline a few goals. Once you’ve established a goal-tracking system, you can include more goals over time.
Your success metrics
Now, you need to think about the metrics you’ll use to validate your goals. If you set SMART goals, then it shouldn’t be hard to find your success metrics.
If your goal is to increase your conversions by 30% in Q2, then you need to report the number of conversions you get.
As you choose your success metrics, be wary of vanity metrics. These are metrics that seem important, but have no intrinsic value to your business. For example, it’s good to have a lot of likes and comments on your Tweets. But if your goal is to generate leads, then likes and comments are not going to cut it.
Success metrics differ for every team, but here are some important metrics you can include in your report:
- Number of leads generated
- Number of conversions
- Total spend (on paid social ads)
- Total return on investment (ROI)
- Total revenue generated
- Social sentiment
- Social share of voice (SoV)
If you’re using social media for customer service, you can also report on metrics like customer satisfaction score (CSAT), net promoter score (NPS), and resolution time.
If you want more info on this, check out this Hootsuite post on the social media metrics you really need.
Your results per social network
Now, you’ll detail the specific results you get for each social media network. If you want to be more thorough, break down these results by format within a network, such as feed posts, Stories, and Reels.
The data you’ll include in this section depends on the goals and success metrics you outlined above. Below is some of the most important information to include of each social platform:
- Number of posts
- Net followers (gain or loss)
- Top-performing posts
- Engagement rate
- Click-through rate
Whatever metrics you choose, include some precious results that explain why you’re including the metric(s) in your report. If you’re reporting on a paid ad campaign, include a similar campaign you’ve done in the past to compare the results.
If you’re creating a weekly or monthly report, track your present results compared to the results you get a few weeks/months back.
You can also compare your results to the same time the year before to check if there were any seasonal trends.
Your wins
After presenting your data, you can start your analysis. First, highlight all the things that went well in this reporting period. These are your wins.
Wins go beyond numbers. If you got on the radar of an industry expert you plan to do a podcast with in the future, that’s a win. If you get glowing reviews on social media that you can use in future campaigns, that’s a win too.
So don’t limit your wins to metrics and numbers. Include your relevant successes in your report, no matter the form they take.
If possible, try to determine why you got these wins. The wins themselves are really cool, but the reasons you got them can help you know what marketing methods work for you.
Your opportunities
After outlining your wins, it’s time to look at your marketing results objectively.
Was there anything that went wrong during this reporting period? If yes, do you know why things didn’t go as planned? And how do you plan to get things back on track?
You should also note any opportunities you’ve discovered through social listening, studying the market, and engaging with your followers.
Is there a type of content your audience wants to see more? Are there any issues that can be resolved through explainer videos, FAQs or better documentation?
If there are, include them in your social media report.
Summary
Conclude your social media report by summarizing all that you’ve achieved and what you’ve learned during this reporting period.
Note some huge takeaways and how they will help you improve your social media marketing strategy.
How to create a social media report
Determine your audience
The first step is to determine who you’re creating the social media report for. Is it your boss, VPs, your team, or just yourself?
When you know who your audience is, focus on what’s important to them, rather than making a general report that contains details that don’t matter to them. The more authority your audience has in your organization, the more concise your report should be.
Focus your reporting
Social media is great for many things—increasing awareness, getting engagement, driving conversions, and more.
It’s really easy to get caught up in all these social media marketing results. But you should focus on the KPIs and metrics that matter most to your company and the stakeholders involved.
Don’t include extra details unless you notice something major or unique.
Gather your data
The next step is to gather your social media data. You can get this data from many different sources. We’ll delve into these sources later in this article
Analyze your data
Raw data doesn’t really mean anything until you analyze it.
When you get the numbers, look for patterns, anomalies and trends that can explain what’s working for you and what isn’t.
Present your findings
Now it’s time to arrange all your data and analysis into a document in a clear and concise way. That document is your social media marketing report.
Free social media report template
To make the process easier, the team over at Hootsuite created a free social media report template you can use to craft your report. This template highlights the most important elements of data you should include in a typical social media report.
After downloading the free template, follow the instructions to customize it. If you’d like to build your own social media report template from scratch, you can also do that.
If your focus is on numbers, you can use Excel, Google Sheets or any other spreadsheet tool to create your template. If you plan to include more analysis, you can gather your data in a spreadsheet and present it with Google Docs or Powerpoint slides.
Or… you can use a social media reporting tool like Hootsuite Analytics to craft custom reports. This gives you access to comprehensive charts and graphics that you can export directly to a spreadsheet tool, PowerPoint or PDF.
Social media reporting tools
Here are the main platforms you can find the data to include in your social media report.
Meta Business Suite
You can find your Facebook and Instagram analytics individually on each platform, but Meta Business Suite combines the data for both platforms so you’re killing two birds with one stone.
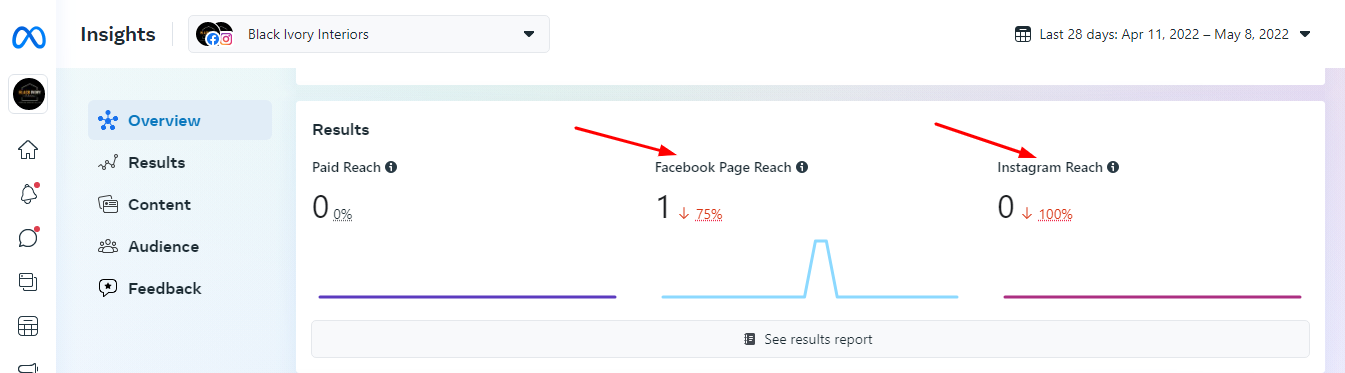
To get your Facebook insights in Meta Business Suite, visit http://business.facebook.com and click insights in the left menu.
Click Export Data on the top right of any chart to export data for your report. You can export your data of choice in .PNG, .PDF, or .CSV formats.
If you’re looking for more detailed instructions, here’s a Hootsuite article on how to use Meta Business Suite.
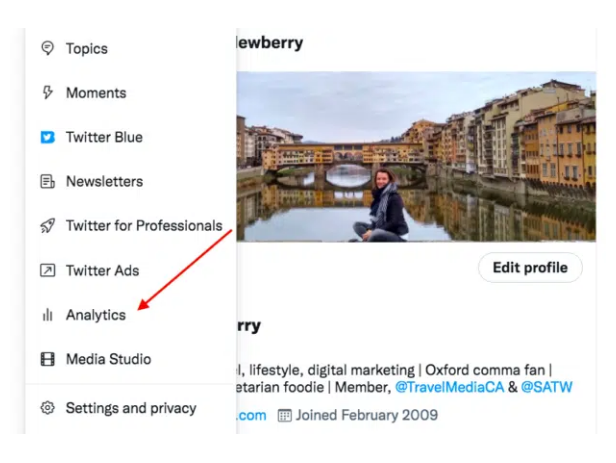
Twitter Analytics
To get your Twitter Analytics, go to your Twitter profile and click on the three dots icon in the menu. Then click on Analytics.
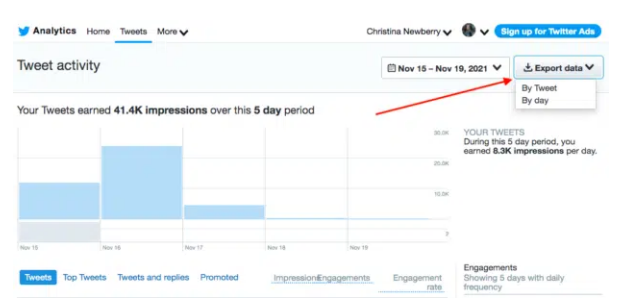
There, you’ll find data on the main analytics screen. To get more information, click the options in the menu of your Twitter Analytics screen. Then click Export Data to export the info as a .CSV file.
TikTok Analytics
You need to have a TikTok Business or Creator account to access TikTok Analytics.
Once you’ve switched to these accounts, go to your profile and click on the three dots. Then click on Business Profile (or Creator Profile) and Analytics.
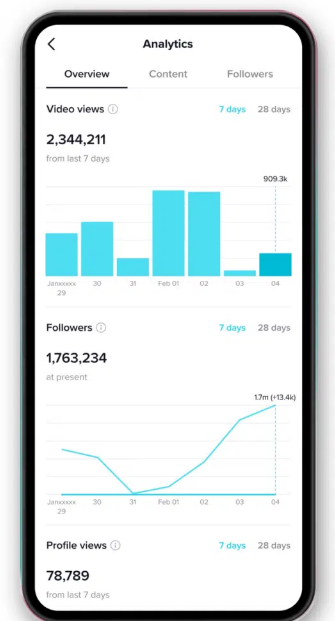
You’ll be able to see how you’re performing on TikTok. You can only export data from TikTok Analytics if you’re using a desktop.
All you have to do is log in on your desktop computer, hover your cursor over your profile image, and click View Analytics. You can get overall metrics for your account, as well as in-depth analytics on each video you’ve posted.
LinkedIn Analytics
To find your LinkedIn Analytics, open your business page and click Analytics in the top menu. Then click on Visitors, Followers, Updates, Competitors or Employee Advocacy.
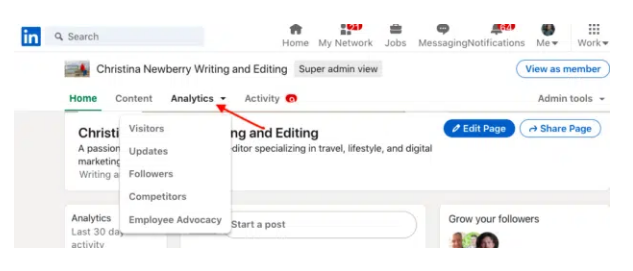
You’ll be able to see metrics like impressions, page views, and engagement rate.
When you click on the Competitor Analytics page on LinkedIn, you’ll be able to see how your company page compares to up to nine other pages, which is pretty cool.
Click the blue Export button on the top right to export your data as an .XLS or .CSV file (depends on the data you’re exporting).
Hootsuite Analytics
Unlike the other analytics tools on this list, Hootsuite Analytics isn’t native to a single platform only. It offers a comprehensive overview of all your accounts across all major social media platforms.
With Hootsuite Analytics, you can collect data and create social media reports for multiple Facebook, Instagram, Twitter, and LinkedIn profiles from one dashboard.
You can also customize the dashboard to track your specified success metrics, including time and team metrics. When you want to build your report, you can customize the information you want to include.
Hootsuite Analytics gives you access to a wide range of charts that will help you visualize your report and make it easy to understand.
You can share social media reports with your marketing team directly within Hootsuite Analytics. Or you can download your report as a spreadsheet file, a PowerPoint, or a PDF that you can share.

To understand how to use the data available on these platforms, check out this Hootsuite blog post on social media analytics.
Use Hootsuite to report all your social media activities and results from a single, intuitive dashboard. Choose which metrics to track, get beautiful visuals, and share reports easily with your team members and stakeholders. Try Hootsuite for free today.