
It’s hard to keep up with all the changes at Facebook (which is why we have our Facebook updates post refreshed monthly), and it can be even more difficult to know what they all mean. That’s why keeping up with the latest Facebook statistics is so important, especially when planning your marketing strategy or convincing your boss to try a new platform.
We can help with that. We’ve gone digging through all the latest research and case studies to find information about Facebook users, their behavior, what marketers can expect, and trends on the platform overall. These can help you shape your marketing and advertising strategies, armed with the most up-to-date knowledge about the platform and how it impacts you.

We did the heavy lifting and selected the Facebook statistics you must know to plan your 2021 marketing strategy and achieve the success you deserve with your Facebook advertising.
In this post, we’re going to take a look at the 27 Facebook marketing statistics that you need to know as we move into 2021, all of which are up to date and from reliable sources.
They are grouped into 5 main categories:
- Facebook Demographics & Usage
- Facebook Marketing Statistics
- Facebook Mobile Statistics
- Facebook Ads Statistics
- Facebook Video Marketing Statistics
Facebook Demographics & Usage Statistics
Understanding who is using Facebook and how will play an important part in deciding what strategies you should use.
Here are the big Facebook demographic statistics to watch.
1. There are 1.82 billion daily active users on Facebook, as of 2020, and over 2.7 billion monthly active users.
Facebook is still seeing consistent growth in usage, meaning that there’s a huge chance to connect with a large portion of your target audience. Despite many people publicly expressing concern about Facebook due to privacy and transparency concerns, there’s no decrease in the number of users signing up and using the app.
2. Approximately 74% of Facebook users visit the site at least once daily.
This means there are more opportunities to reach users, especially since about half of all users are opening the site at least twice per day. Whether you’re using organic marketing or paid ads, keep this in mind; this platform is still valuable.
3. People spend an average of 38 minutes per day on Facebook.
With people on the platform for this long, this is more than just idle scrolling every time they log on. People are engaging, socializing, and making connections. We’ll look at how exactly they’re doing that a little later on.
4. Facebook has more than 500 million daily viewers on Stories.
While this may seem like only a small fraction of the overall number of users on Facebook daily, this is still a huge percentage, especially considering that the Stories feature is growing. I always recommend that my clients use Stories, just because it helps your organic reach and increases the likelihood that engaged audience members will see your content on a regular basis.
Keep in mind that you should absolutely be using this feature for Instagram too, so taking a little extra time to upload Stories on Facebook, is easy.
5. Facebook users made an average of 5 comments, 12 post likes, 1 share, and 1 Page like in October 2020.
They’re engaged, but quietly; this shows that many users are most likely to comment or like content when it’s directly relevant to them. Many more will see content, process it, and not engage.
6. The average engagement rate for Pages with fewer than 10,000 fans is about .52%, but as you gain more fans, the average decreases.
The engagement rate drops to .28% when you have somewhere between 10,000-100,000 fans, and only .10% when you have over 100,000 fans. Focusing on creating user-oriented content that your audience will be receptive to can help keep engagement rates high, but creating Facebook Groups can also help combat low reach and engagement rates.
7. WhatsApp (which is owned by Facebook) and Facebook Messenger are the two most popular Messenger apps all over the world.
WhatsApp is the most popular in 138 countries, and Facebook Messenger is the most popular in 74. The third-place option is Viber, which is only the most popular in 7 countries. Since there’s been a Whatsapp, Messenger, and Instagram Direct integration, expect that this will be a primary method of social communication between you and your customers.

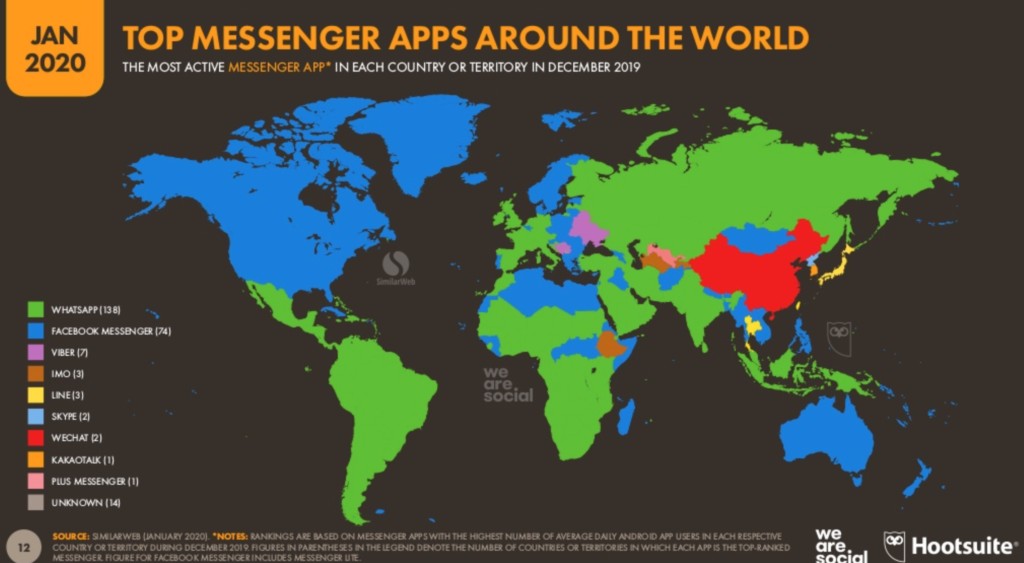
Image source: Hootsuite
Back To Top
Facebook Marketing Statistics
We know there’s a huge opportunity for connecting with our audience, so now let’s take a look at several general marketing statistics that showcase some buyer behavior, marketer behavior, and more.
8. Facebook has a total of 90 million Pages for SMBs.
This does, unfortunately, mean that the competition is fierce and that more businesses are flocking to the platform. That being said, many small and medium businesses (and even larger ones) fail to engage their audiences properly; if you’re able to do so, you’ll be good to go.

9. The average organic reach for a Facebook post is 5.2% of the Page’s total likes.
The key phrase here is “average,” because brands with consistently lower-engaging content and less on-platform activity will see reach rates even lower. Still, it’s good to have a solid number as a guideline, and to know what to expect.
10. 1.4 billion people have joined Facebook Groups that they derive value from.
Facebook Groups was the big thing of 2018. More groups are popping up, and we’re rapidly getting new features (including the option to create paid groups and some outstanding group insights). If your business is able to create a branded group that provides value and a sense of community to your customers, you’ll have a better chance to showing up in their feed and building a relationship with them on social.

11. 78% of American consumers say they’ve discovered products on Facebook.
That’s an enormous percentage, and it shows that people are willing to come across products and services that would be useful to them and purchase. They just need to see ad copy that’s engaging and directly relevant to them, and they might need to see ads from a company a few times before they convert.
12. Posts with images account for 55% of total Page posts; video posts account for 22.2%, and link posts make up 18.5%.
Pages and businesses understand the importance of adding media to their content, knowing it can lead to both boosts in engagement and the algorithm (which, of course, go hand-in-hand). The majority of your Page posts should include at least one visual element for best performance.

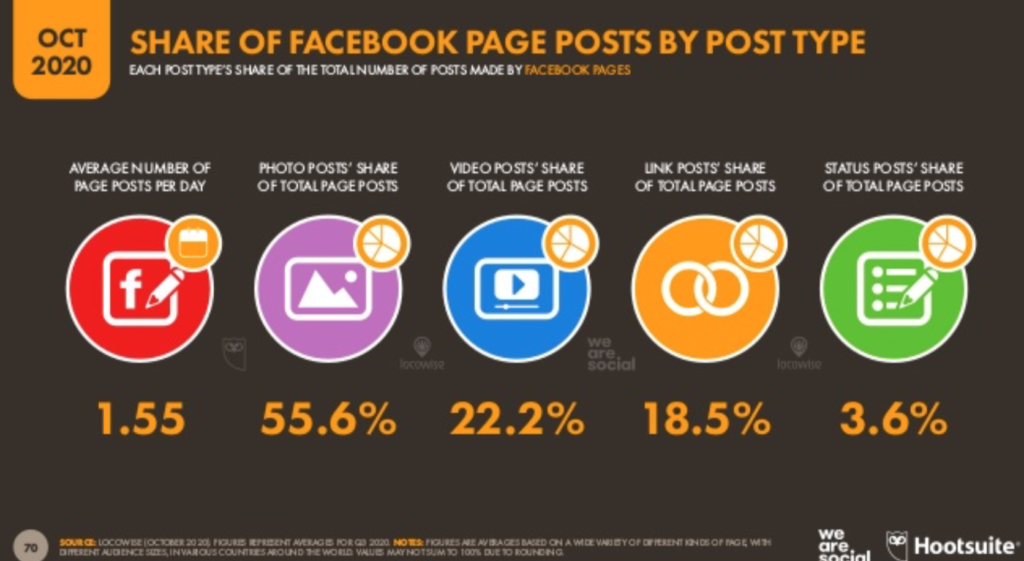
Image source: Hootsuite
13. Facebook is the second most popular social media platform, used by 74% of users ages 16-64 in a one-month period.
YouTube was first, with 79% usage. Facebook Messenger was third at at 55%, and Instagram was fourth at 52%, keeping multiple platforms in the Facebook family in the top four.
14. 17% of users in one study cited “following brands or companies” as a reason why they used Facebook.
While 88% said they jointed the platform to keep in touch with friends and family, the fact that almost 1 in 5 users said that connecting with brands was a motivation for usage is significant. Users want to engage with brands, and it’s up to businesses to create interesting, valuable content to keep them paying attention.
Back To Top
Facebook Mobile Statistics
The whole world is going mobile, and Facebook is no exception. Let’s take a look at a few statistics that reflect on what this means for marketers.
15. 79% of Facebook users only access the site through mobile.
While a large number of users are exclusively using the app, the majority of users use mobile at least sometimes. All your content should be mobile-optimized: i.e., vertical videos, readable posts with short paragraphs, and mobile-ready landing pages.
16. 80.5% of Facebook access on mobile happens on Android devices, and 14.3% happens on iOS.

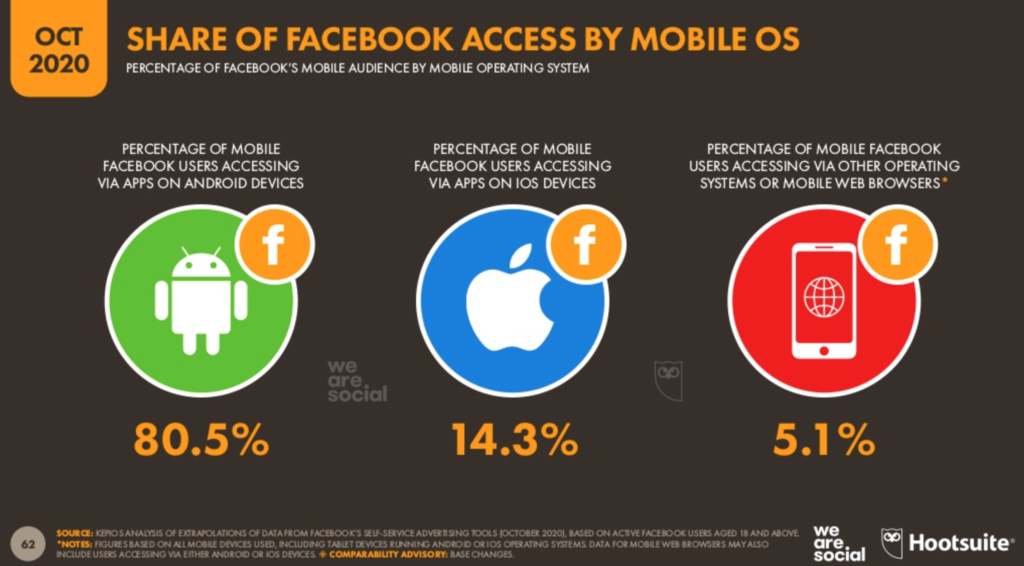
Image source: Hootsuite
This shows the importance of ensuring that your ads (and their landing pages) are compatible with both device types. It’s also a good reminder to run app installation ads targeted to users of the correct iOS, sending them to the right landing page for their specific device.
17. 96% of Facebook visits are made on smartphones.
The fact that such a small percentage of Facebook visits happen on desktop is significant. That being said, sometimes longer duration periods of usage will happen on desktop, but you need to be ready to capture users no matter what platform they’re using.
18. The mobile share of ad revenue has skyrocketed over the past decade from 11% in 2012 to around 94% in Q3 2019.
This is anything but surprising since mobile usage has increased so dramatically and is now the most common type of device used to access the site. As a result, advertisers must remember to use mobile-first creatives that will display well on phones and tablets. This is only a trend that will likely continue well into the coming years.
Back To Top
Facebook Ads Statistics
You knew we couldn’t have a post on Facebook statistics without including a section on Facebook Ads!
Here’s some of the latest research about how users are interacting with our ads and the impact you might see from them.
19. Facebook (and its ads) accounts for 80.4% of U.S. social referral share to eCommerce and retail sites.
That’s slightly more than one out of four customers who click on your ad. This shows the power of connecting with the right audience. While many businesses are focusing on other platforms, this is a reminder of what a powerhouse Facebook is.
20. The average Facebook user clicks on 11 ads per month.
Despite some people vocally complaining about on-platform ads, most users don’t actually have an issue with ads themselves, and are happy to engage with ads that are directly relevant to them.

21. The average cost per ad has decreased throughout 2020.
While ad cost had started decreasing in Q4 of 2019, some experts believe that in 2020 costs continued to fall due to some businesses investing less into the platform due to COVID-related budget restrictions.
22. The average CPC on Facebook was $0.39 as of September 2020.
Ad costs fluctuate, and they typically do have a temporary increase during the end-of-year holiday season, but this is an affordable, accessible price for a large number of brands.
23. Brands can reach approximately 2.14 billion users on Facebook with the ad system.
Many of these users admittedly won’t be in your target audience, but even 1% of 2.1 billion users is a pretty exceptional reach for scaling businesses.
24. The average video CTR ranges from 1.05% to 3.42% on Facebook Ads, varying by the age of the user.
Users 18-54 range from 1.05% to a 1.35% CTR. Users 55-64 have a 2.38% CTR, and those 65+ have a 3.42% CTR. Don’t count out older audiences, as they can be active participants on the platform.
Back To Top
Facebook Video Marketing Statistics
Facebook video marketing is incredibly important. Here are the biggest updates that you need to know.
25. Video that’s optimized for mobile (with vertical formats) has a 27% higher brand lift.
Think both in-feed videos and Story Ads. You want to be using 16:9 aspect ratios on your videos so they can take up the user’s full mobile screen. Including captions is also a helpful step, as we know that watching without sound is all too common.
26. Mobile accounts for more than 50% of Facebook’s ad revenue from video.
Mobile usage has consistently increased year-over-year, and with advertisers now optimizing for mobile accordingly, it’s no surprise that more users are consuming video ads on platform.
27. Facebook live video receives 6x more engagement than standard videos.
Users respond well to live video as a whole. They’ll sit in wait rooms before the live launches, attend “live” events on Facebook, and engage enthusiastically. Brands should be using this feature in their content strategy to increase engagement and build relationships with their target audience.
Back To Top
Conclusion
In 2021, Facebook is still essential for marketers and businesses of all sizes and from all industries.
Even with organic reach declining, both organic marketing and on-platform advertising offer huge potential to help you effectively connect with your audience in meaningful ways.
Users are still engaging with the platform regularly and enthusiastically, and they’re increasingly using it to find community instead of just getting updates.
If you keep that in mind, you’ll be able to adapt alongside the platform as it evolves and continue to see results, no matter how fierce the competition gets.
What do you think? Did any of these statistics surprise you? Which statistic will influence your campaigns the most? Share our thoughts and questions in the comments below!