

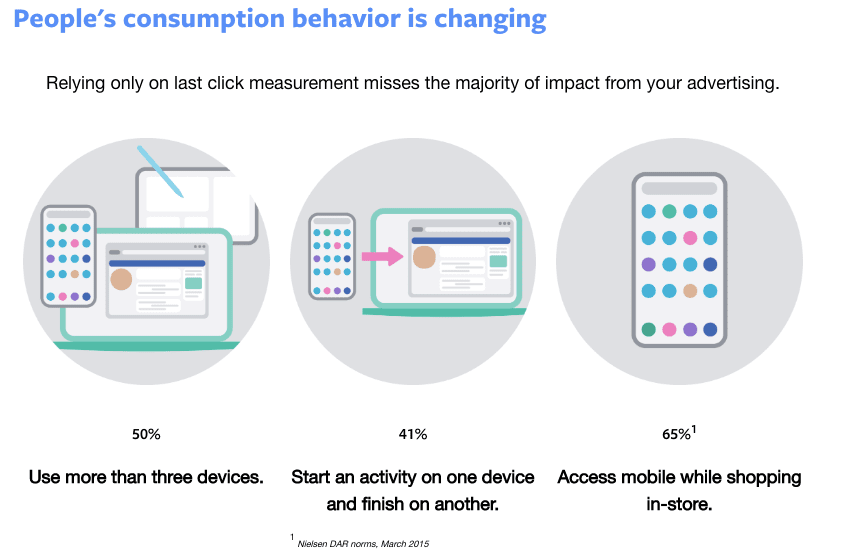
Our customers live in a multi-channel world. To survive and thrive in this advertising realm, we must too.
Connecting how people move across devices through the consumer journey is essential to determining which ads are really driving conversions.
Each interaction contributes to the eventual conversion, but if those touchpoints aren’t tracked, we have no way of knowing which ads, platforms, and devices are working – and ultimately, which are making (or costing) us the most money.
In this article, I’ll show you:
- What the Facebook Attribution tool is
- How to set up the Attribution tool
- How to select your Attribution model and window
- Four unique ways to analyze and optimize your customer journey using this new feature
Let’s dive in!
What Does the Facebook Attribution Tool Do?
In a dream world, every person who clicked on our ad would immediately buy our product. Much to all of our chagrin, this is not the case.
The path your audience can take from prospect to customer has almost infinite possibilities according to the device, browser type, or even the normal day-to-day habits of the person you’re trying to reach.
Take the following infographic from Facebook:

Let’s take a moment to ponder this from the customer perspective.
You’re in the market for a new phone. You may start out by browsing a couple of sites looking for reviews and even visiting a few name brand websites.
Next, you see an ad on your mobile device. You click, but ultimately decide not to purchase. You see the ad later the same day on your desktop, but do not click this time.
Finally, 3 days later, you go to the website (without seeing or click an ad) and purchase it.
Sound familiar? To most, this is an accurate representation of how most people go about purchasing items (especially those items with a heftier price tag).
Now, let’s flip the tables and look at it with our Advertising hats on.

How do you even start to define which part of the process above really drove the final purchase?
Was it the first advert that was seen, or the last one that was viewed? Should you weight some actions more than others? How do we correlate an in-store purchase to an ad that wasn’t even clicked? How do you cross-reference this data with my advertising on other platforms?
Where do you even go to find the answers to all of these questions?
If you’re starting to panic, don’t worry – this is the problem the attribution tool aims to solve.
Traditional marketing attribution tools that rely solely on cookies and last-click attribution may not be giving you a complete picture of what parts of your advertising really drive business outcomes.
Facebook Attribution is an advertising measurement tool designed to give you a more complete picture of your customer journey, so you can make smarter business decisions.” – Facebook
In layman’s terms, with the Attribution Tool, you can import data from other advertising platforms and offline data so you can get an overview of your customer journey on and off of Facebook.
It does this through people-based multi-touch attribution.
That was a mouthful, so let’s break this into two parts.
People-based:
Most tracking these days uses cookies to track user actions. This feature, while great in its own ways, can actually miss critical touchpoints during the user journey (specifically, cross-device interaction).
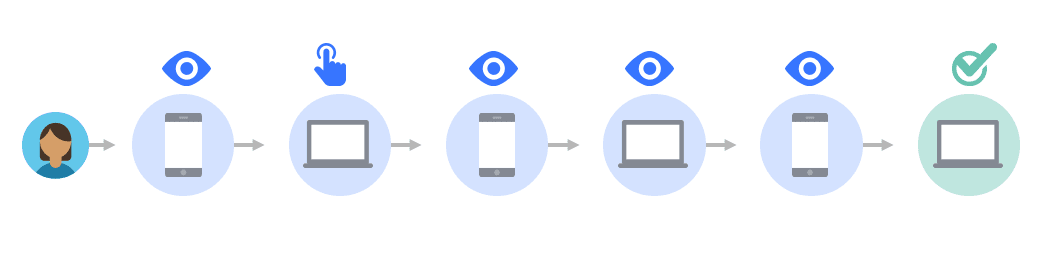
Let’s look at the following example:
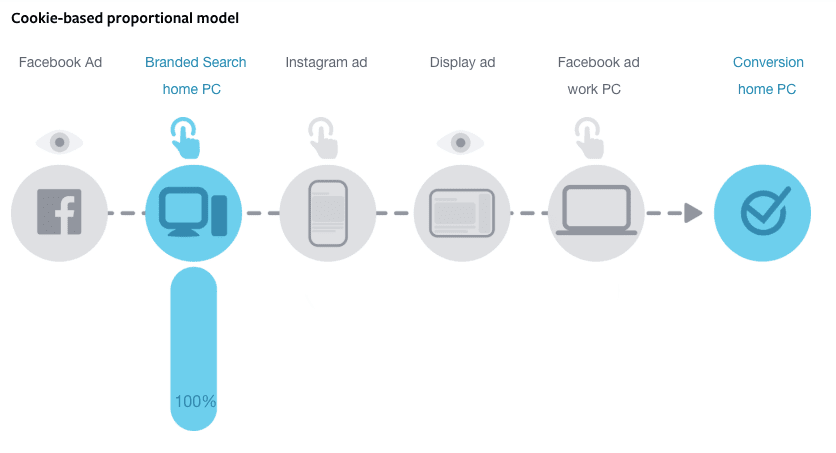

In this chart, even though the user went through multiple steps and touchpoints, only the last ad clicked (which had the cookie) was attributed to the conversion.
From an advertisers view, this isn’t optimal.
Multi-touch:
By utilizing their unique ability to attach a specific person across multiple devices, this method allows us to get a more comprehensive and holistic view of all the actions (or inaction) that lead to our ultimate conversion.
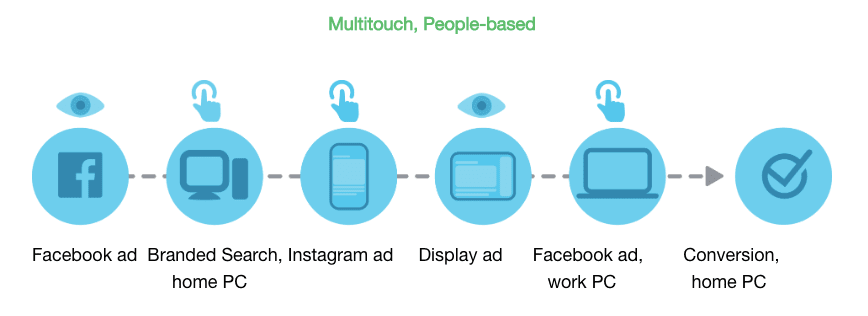

As we can see from this updated image, we can now confidently measure the other touchpoints more efficiently, leading to better analytics and optimization opportunities.
Now that we’ve explained the basic terms, let’s get into the fun part…getting everything set up!
Setting Up the Facebook Attribution Tool
Before you even get into the actual details, you’ll need to make sure you have a Business Manager account.
Even if you’re just running ads on one Ad Account, this is a good move anyway as you will need Business Manager for a variety of other tools and features.
For a full guide on that process, you can check out this article written by AdEspresso’s Head of Education, Paul Fairbrother!
After you’ve created your Business Manager account, you’re ready to get started.
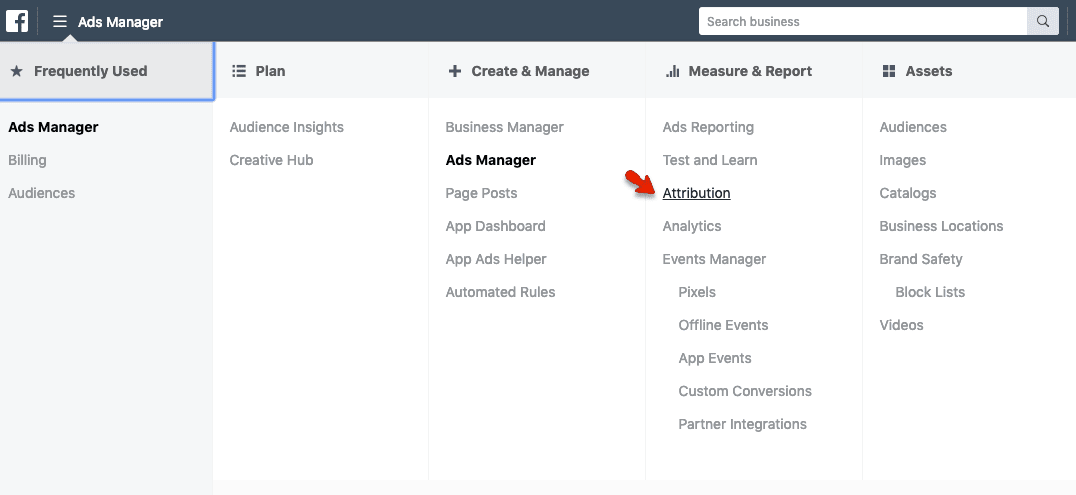
To access the Attribution tool, head over to Ads Manager and select Attribution under the Measure & Report tab.

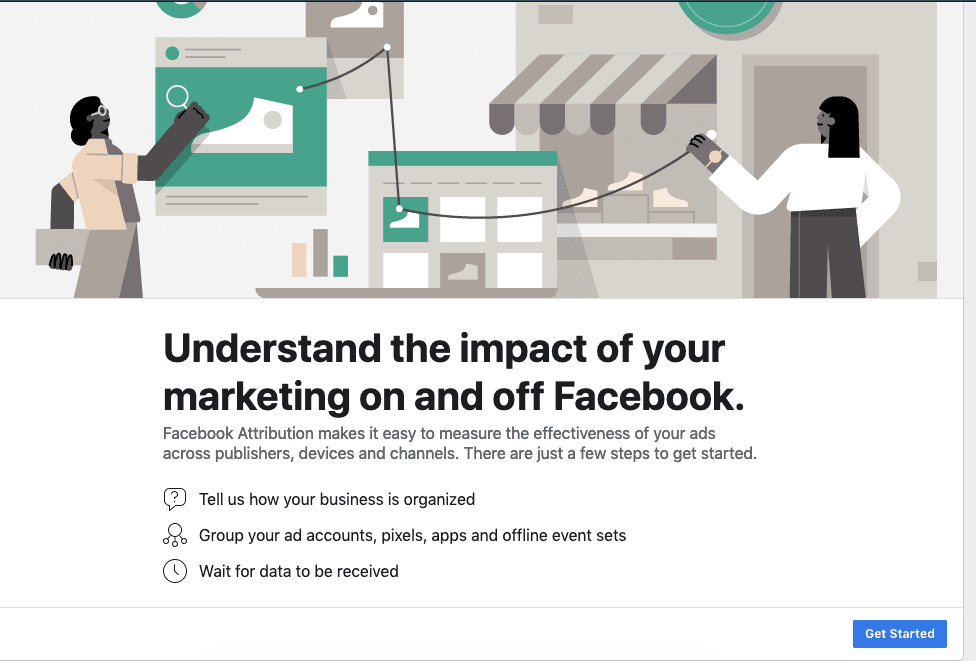
You’ll then be led to the next page, which gives a very short overview on what we’re going to do next – which is to define our business model and connect our advertising assets into one ‘Line of Business’.

Depending on your current situation, the next page may seem a little tricky, but let’s break it down.
Now Facebook wants us to define how our business is organized.
The reason it does this is to ensure that we are only looking at one business at a time in our attribution. It wouldn’t help us to mix data from 3 or 4 completely different businesses in one place, after all.
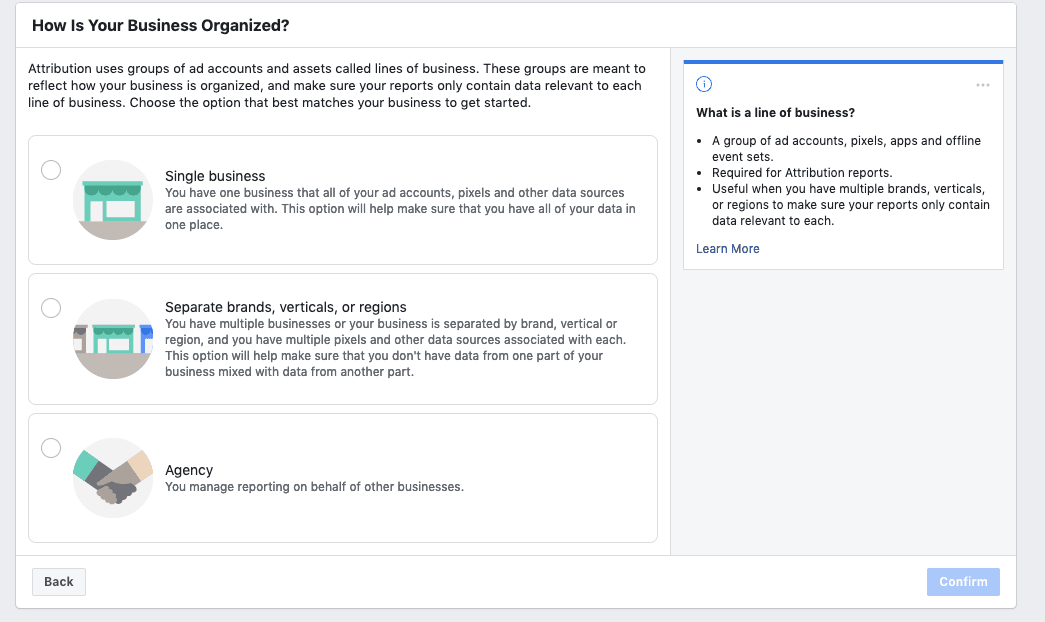

If you’re advertising on behalf of one business and one business only, then choose the Single business option.
If you‘re advertising on behalf of one main brand, but have different marketing regions or multiple ad accounts and pixels, select Separate brands, verticals or regions.
Lastly, if you’re an agency who manages ads for other businesses, select Agency.
Now that we’ve indicated our business model, our next step is to correlate the assets to a unique Line of Business.
Essentially, we’re just connecting related ad accounts, pixels, etc to a business in order for the attribution tool to analyze the components correctly.
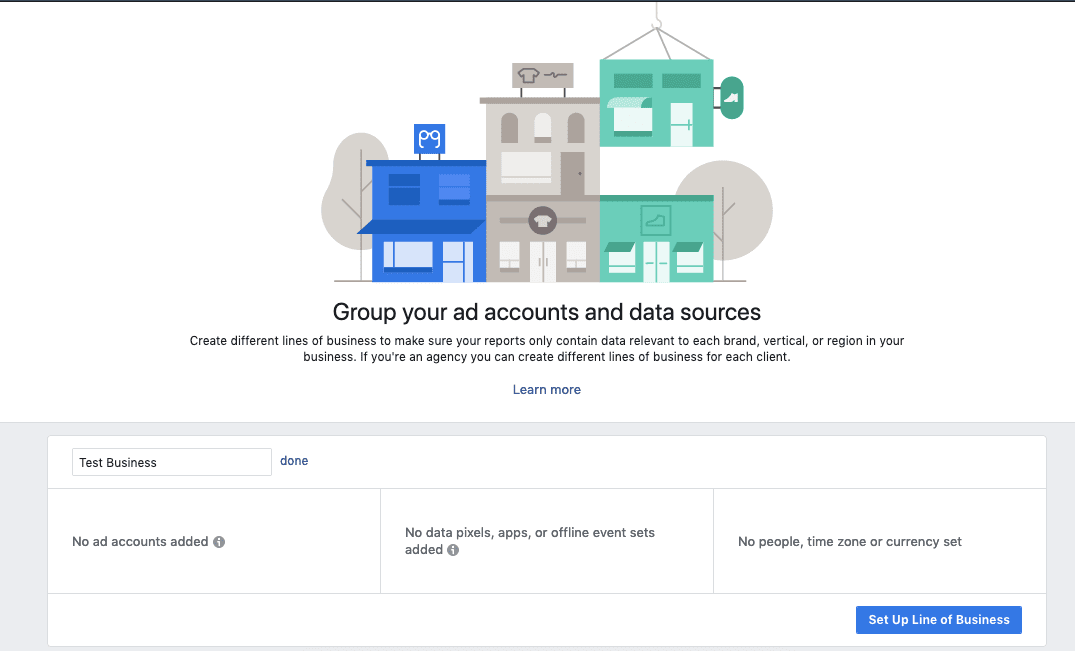

Select Set Up Line of Business at the bottom of the page.
Now, you can choose the assets to group into this business.
Remember, the Time Zone and Currency is something you cannot change after this has been set up so choose wisely!
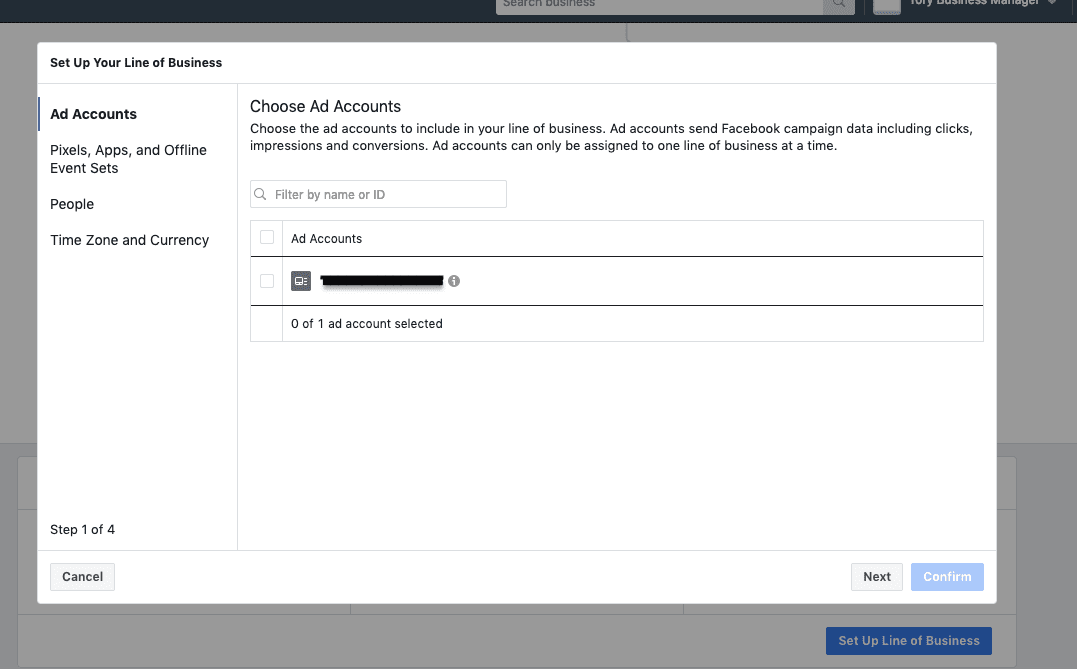

After you’ve connected all of the components, you can select confirm on the bottom right-hand side of the screen.
If you see the next screen, you can give yourself a big pat on the back – you’ve completed the first part of this process!
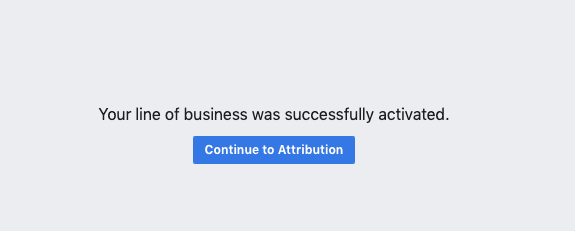

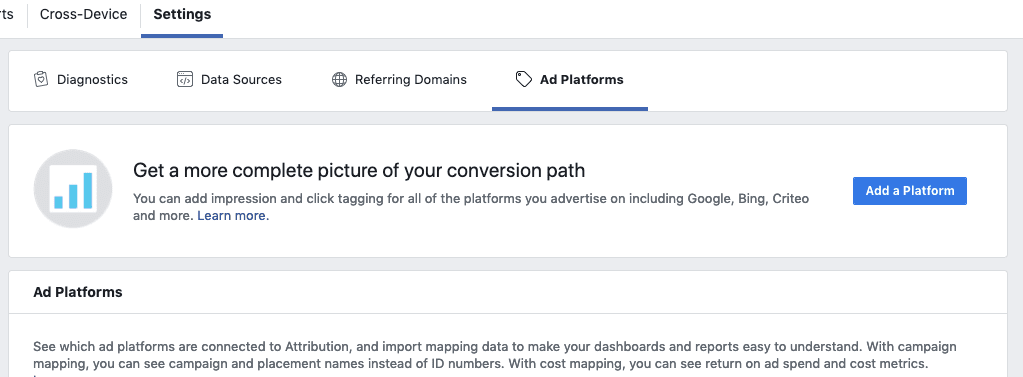
The next thing we want to do is add another component to this – another ads platform!
This is where the tool will really shine for us – you can connect up to 37 different ads platforms including Google Ads (Search & Display), Bing, and LinkedIn to name a few.
To do that, we’re going to head over to the Ad Platform tab located under Settings and click Add a Platform.

Some of these are relatively simple to set up, and only need a few easy steps to complete. Some require more manual work to configure.
We could write an entire post about all the ways to connect each of the offered platforms, but we’ll leave it to Facebook’s expert documentation to help with that part.
After you’ve connected all of your other ad platforms, you’ll see the following diagnostic page with the status of your data.
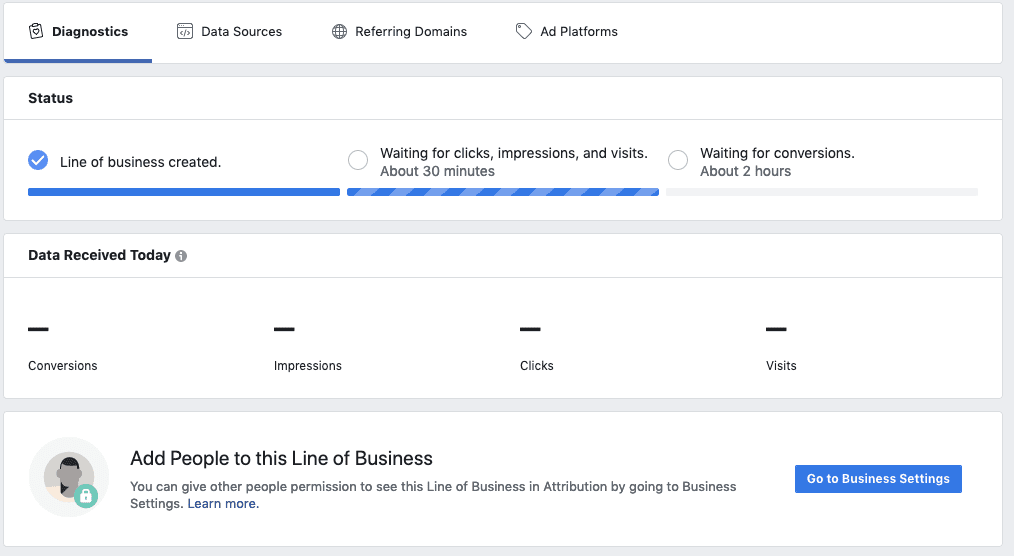

As we see from the image above, it takes some time for Facebook to sync all of the data into the Attribution tool.
In the meantime, we can start to set up a few other key components – specifically:
- Conversions
- Attribution windows
- Attribution models
- Rules
If we look over to the upper right-hand side of our screen, we see some additional configurations.
The first is our conversions.
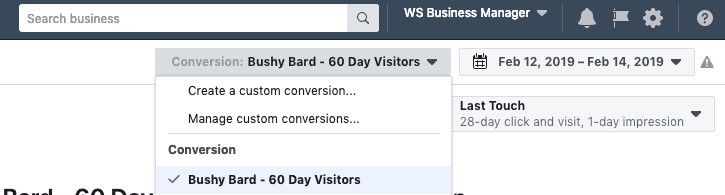

From here you can choose any conversion you have set up previously, or you can even create a new one. This could be your purchases, page views, leads, etc.
This will be the foundational point for the rest of the data we’ll be analyzing today!
We’ve come a long way in this setup so far, but we have another 2 features we most cover before we get to the analytics – choosing the correct attribution settings.
This next bit is the most tedious but important part of this process, so grab a drink and settle in.

Choosing the Right Attribution Settings
Now, getting our data into one place is only the first step.
Now we need to decide our Attribution models and windows.
Before we head any further into this chapter, I want to let you know what we’re about to get into is some really advanced marketing. The Quantum Theory of Advertising, if you will.
If this is something you don’t understand with the first read, by all means, take your time.
Even some of the most advanced advertisers struggle with attribution, and to be blunt, 100% accuracy is not going to be attainable for anyone at the moment.
We’re going to be discussing two main points in this section – Attribution Models and Attribution Windows.
Attribution Models
My favorite definition of this term is a short and sweet one from Google:
An attribution model is the rule, or set of rules, that determines how credit for sales and conversions is assigned to touchpoints in conversion paths.
Essentially, the Attribution Model will be the formula we use to determine which of our touchpoints (clicks, impressions, views) gets credit for the conversion (leads, purchases, etc).
Facebook offers several pre-configured models for you to choose from:
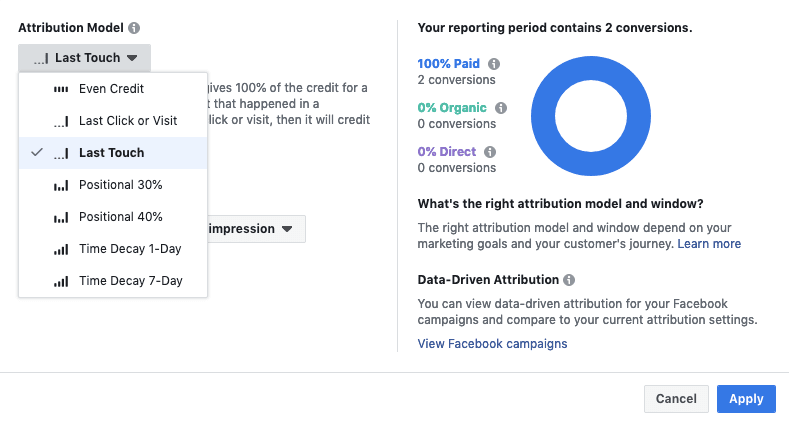

- Last Click – Last Click attribution is what most advertisers are using, however, it’s not the most reliable. With this model, the last click the user made gets the credit for the conversion.
- Last Touch – Last Touch is very similar to the Last Click model, but in this case, the last click or view will be counted instead of only focusing on the click itself.
- Equal Credit – Just like it sounds, every touch point will be weighted equally.
- Positional 30% – Now, this one is a bit trickier. With this model, the first and last actions carry 30% of credit for the conversions. The remaining percentage is divided up among the other touch points.
- Positional 40% – This one is trickier still. Similar to the last option, the first and the last touchpoint receive 40% of the credit for the conversions. As before, the rest is divided among the other touchpoints.
- Time Decay (1 Day ) – With 1-Day Time Decay attribution, instead of weighing one event over another, we actually weigh the touchpoints based on recent activity. With this option, the percentage of the credit is weighted towards the touchpoints closest to the conversion. So, if your customer had 5 touchpoints, point 3 and 5 would be given more credit than the first.
- Time Decay (7 Day halflife) – The 7 Day option is a little different. With this setup, instead of weighting the actions more heavily the closer to the conversion they are, this evens out the credit over time.
Now that you’ve read these, you’re probably either: fighting a migraine or wondering which of these options is the best for you (or both)!

Our team prefers the Time Decay options, as we feel it gives a better overall representation of the entire process and the customer journey.
You can change this at any time, so you can play around with the 1 or 7-day options to see the results you get. (We’ll get to that in just a minute).
At the very least, you would want to stay away from the Last Click or Last Touch options, as that’s precisely the opposite of what we’re trying to do.
Choosing Your Attribution Window
Now that we’ve selected the model or formula that we’ll use to credit our touchpoints, we need to calculate the timeframe (window) that we’ll use to attribute our conversions to our touchpoints.
Like the Attribution model, there’s more then you can shake a stick at.
All in all, there are 17 total choices you can make.
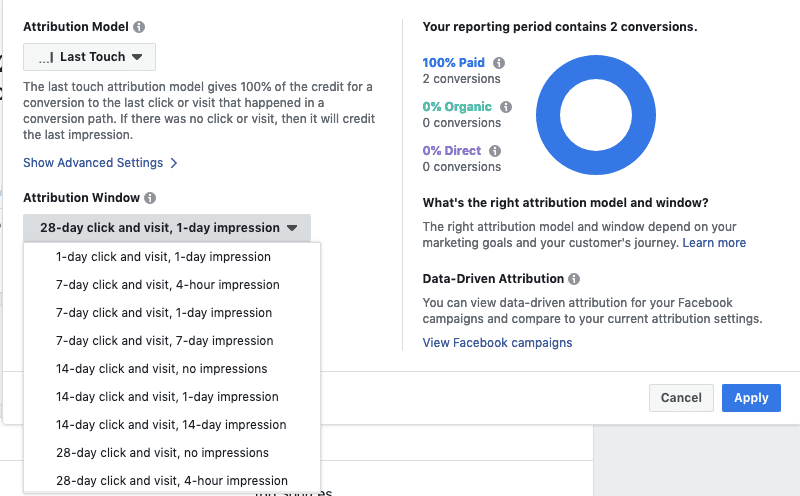

The default choice will be the 28-day click and visit, and 1-day impression option.
This means that the conversions that happened via clicks or visits in the last 28-days OR impressions within 1 day to be given credit towards the touchpoints.
We find ourselves at the same old question: which is the best option?
Generally, if your product has a low ticket price or your customer journey has a short cycle, you can stick with the default option.
If your journey is longer (think, big-ticket items like phones, cars, houses, etc) you may want to move towards the lengthier options in the list.
The longest window you have is the 90-day click and visit, and 90-day impressions, which is the very last option in this dropdown.
If you’re just not sure, you can always compare Attribution windows in ads manager by following the steps listed in this guide.
4 Ways to Analyze and Optimize Your Customer Journey
We’ve connected our assets. We’ve given Facebook all the data we have to give. We’ve waded through the deep, dark waters of attribution.
Now, my friends, we’re ready to get to the best part – the analytics!
After a few days, you’ll start to see more data pull in from all of the advertising assets that you have connected up until this point.
Now, how much data you have depends on how much you are spending through all the channels.
Some of you who are beginners may need to wait a few weeks in order to have enough data to play around with.
As a general rule, whenever we look at analytics in this capacity our brain tends to get overwhelmed very quickly. It’s important to note that before you even attempt to dive into the details you must define the questions you want answers to.
I’ll outline four to help you get started.
1. Measure the Impact of Paid, Organic, and Direct Sources
This one is a no brainer and is the first thing you’ll see on your dashboard – so it’s by far the easiest one to view.
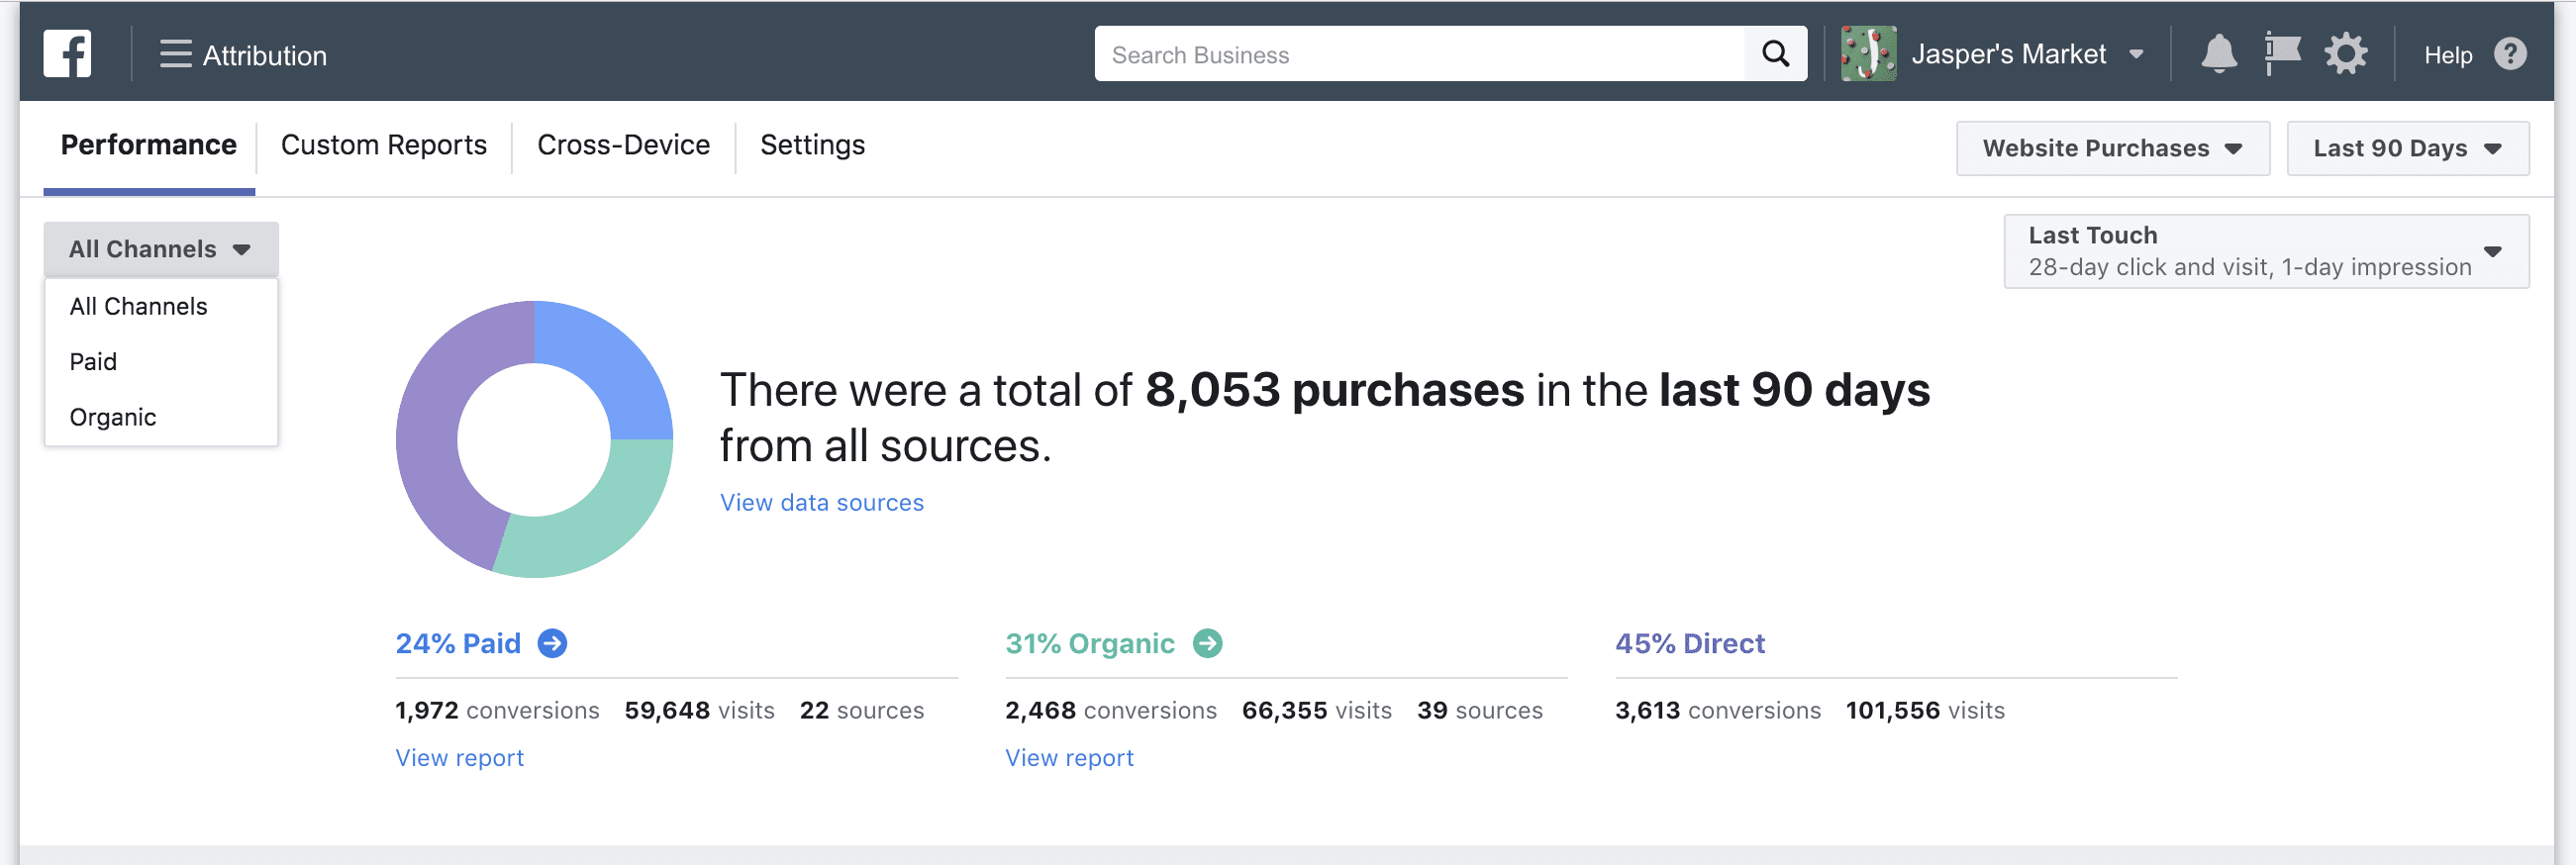

Now the classifications for what are considered Paid, Organic and Direct are, like everything else in this article, a little tricky.
Facebook categorizes these three types by detecting URL parameters and referring domains.
Here’s the official verbiage from their help article:
-
Paid sources:
Includes all paid clicks and impressions, and any visits with UTM parameters that have been detected in the referring ad URL (ex: utm_source, utm_campaign).
-
Organic:
-
Direct:
ACTION ITEM
While in this view, start experimenting with the attribution models we set up earlier.
Do you see a major difference in the 1-Day versus 7-Day attribution?
2. Check Your Multi-Device Customer Journey
One of the best uses of this tool is the ability to determine how multiple touchpoints contribute to our conversions. Specifically, how are our customers interacting with our content on different devices from initial ad to final purchase.
Take this example:
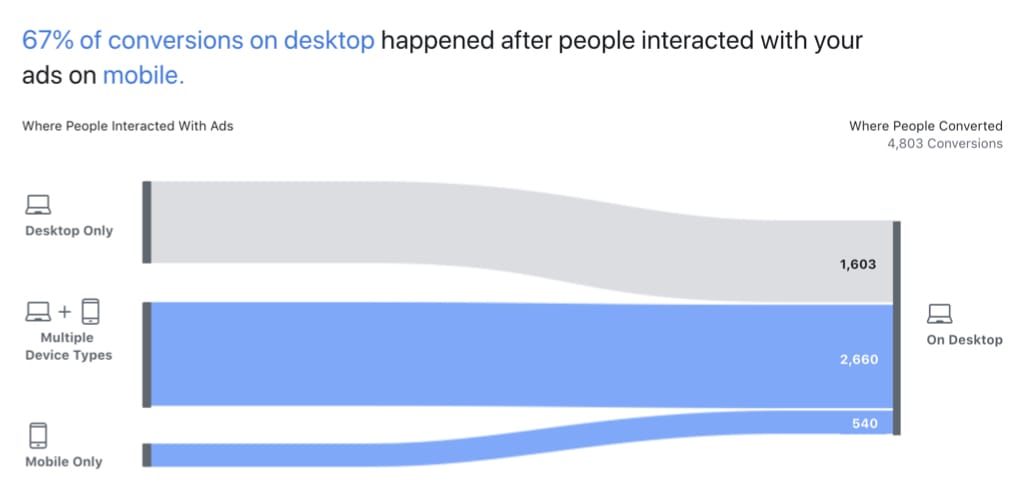

With the attribution tool, we can see that 67% of our conversions from desktop are happening after people interact with an ad on mobile.
While this could be normal under certain circumstances (perhaps they clicked the ad while in line at a coffee shop, and then decided to purchase later at home) it also could be an indication of a poor mobile checkout experience.
ACTION ITEM
Dive into your cross-device metrics. Is there a certain trend with desktop purchases after mobile interaction?
If so, test your checkout experience and see if you can improve the navigation and speed of purchase.
Optinmonster has a great guide on how to increase your mobile conversions here.
3. Analyze Different Conversion Events from Your Funnel
For most businesses, the purchase conversion will be the very first metric you want to analyze – and for good reason.
However, It’s important to focus on every part of the customer journey, not just one.
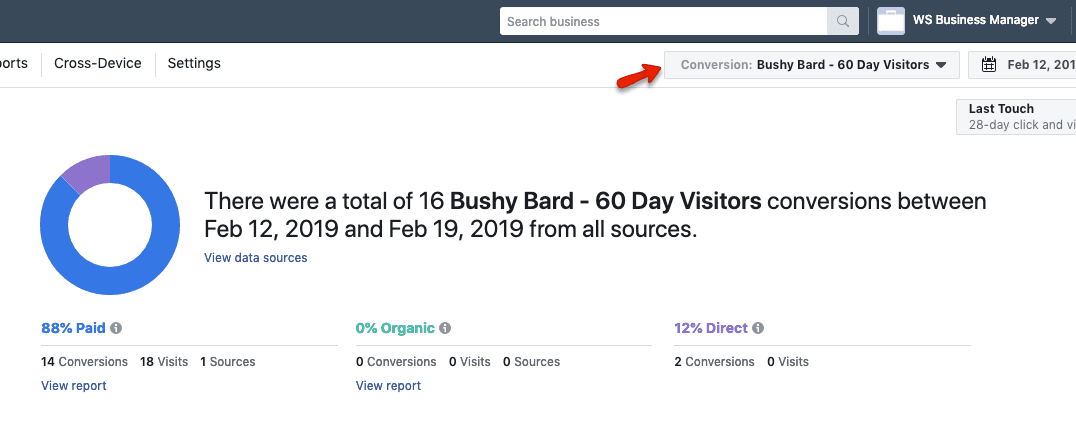

At the top right-hand side of the screen, we can change the current conversion to any that we had set up and attached previously.
The data will then reset and you’ll see the statistics for that specific event.
ACTION ITEM
Analyze each conversion that falls along the customer journey. These might be things like page view, add to cart, add payment info, add to wishlist, etc.
Pay attention to the top sources for these events and see how they measure up against your final step (purchase).
Try changing the attribution model as mentioned in step 1.
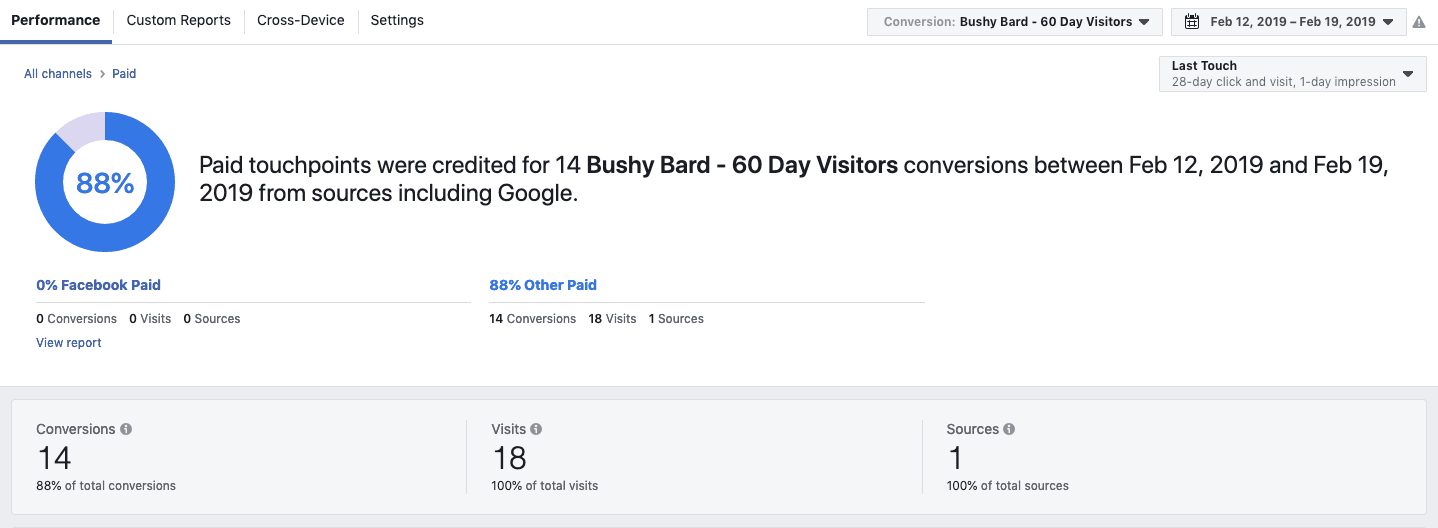
4. Review Your Top Paid Sources
Now, the most important part – seeing where the dollars really paid off.
After we’ve connected our other ad platforms (and have waited a few days for the data to populate) we can see which of our paid sources gave us the most bang for our buck.
You can click on the Paid anchor text to view the Paid channel analytics.

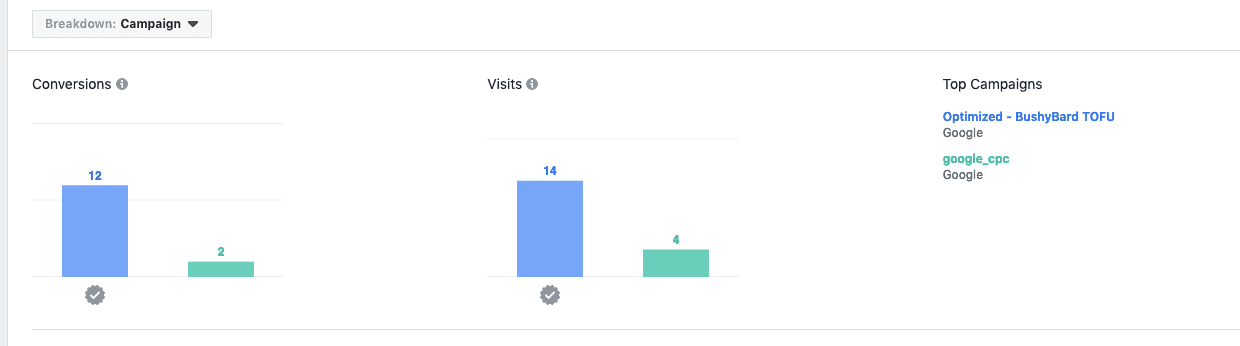
If you scroll down a bit farther, you can also choose to breakdown the data by campaign name for an in-depth view of the results:

ACTION ITEM
Just like we did in the previous step, take a look at each of the steps through your customer journey and note any trends you see.
Take a look at the campaigns that had the most impact, and note any similarities or room for improvements!
Are you Ready to Use Facebook Attribution Tool?
Yes, you made it! We’re at the end of this guide!
We’ve covered the differences in cookie/people based tracking, what the Facebook Attribution Tool is, how to set it up, and finally how to use it for success.
Whew!
I know this article has been full of advanced information, and you may need a few days to process it – and that’s okay!
While this tool may not be for the faint of heart, being able to understand how your customer interactions with your advertising and optimize your customer journey is essential to creating a growth engine that works.