


Facebook Relevance Score estimates how well your ads resonate with your target audience.
To create this score, Facebook looks at your ad draft, considers the audience’s potential positive and negative feedback, and boils it down to a score of 1 to 10. Once the ad is live, your score updates based on the actual feedback received.
In essence, the higher your score, the more likely Facebook is to put your ads in front of the right audience. And, as an added bonus, you’ll see slightly cheaper ad costs.
In 2019, Facebook started rolling out a new set of Relevance Diagnostics that break up the Relevance Score into three separate dimensions:
Quality Ranking, Engagement Rate Ranking, and Conversion Rate Ranking.
In this post, we break down what each of these new rankings means and suggest you strategies to help you capitalize on the additional information the rankings provide.
Relevance Diagnostics and Why They Matter
Unlike other metrics, Facebook’s Relevance Score and the newer Relevance Diagnostics help you understand the wants and needs of your target audience instead of merely showing the success or failure of your ads. If you know how to use these scores well, you can learn from your underperforming ads.
Disclaimer: You won’t be able to see Relevance Diagnostics on ads with fewer than 500 impressions.
Using information gathered from no fewer than 500 impressions, Facebook formulates an informed ranking, which they categorize into one of five different levels:
- Above Average (55th percentile and above)
- Average (35th to 55th percentile)
- Below Average (Bottom 35% of ads)
- Below Average (Bottom 20% of ads)
- Below Average (Bottom 10% of ads)
Moving up in these rankings will increase the possibility of your ads being displayed by the right audience.
And according to Facebook:
It’s more impactful to move a ranking from low to average than it is to move a ranking from average to above average, so focus on improving low rankings rather than on improving average rankings.”
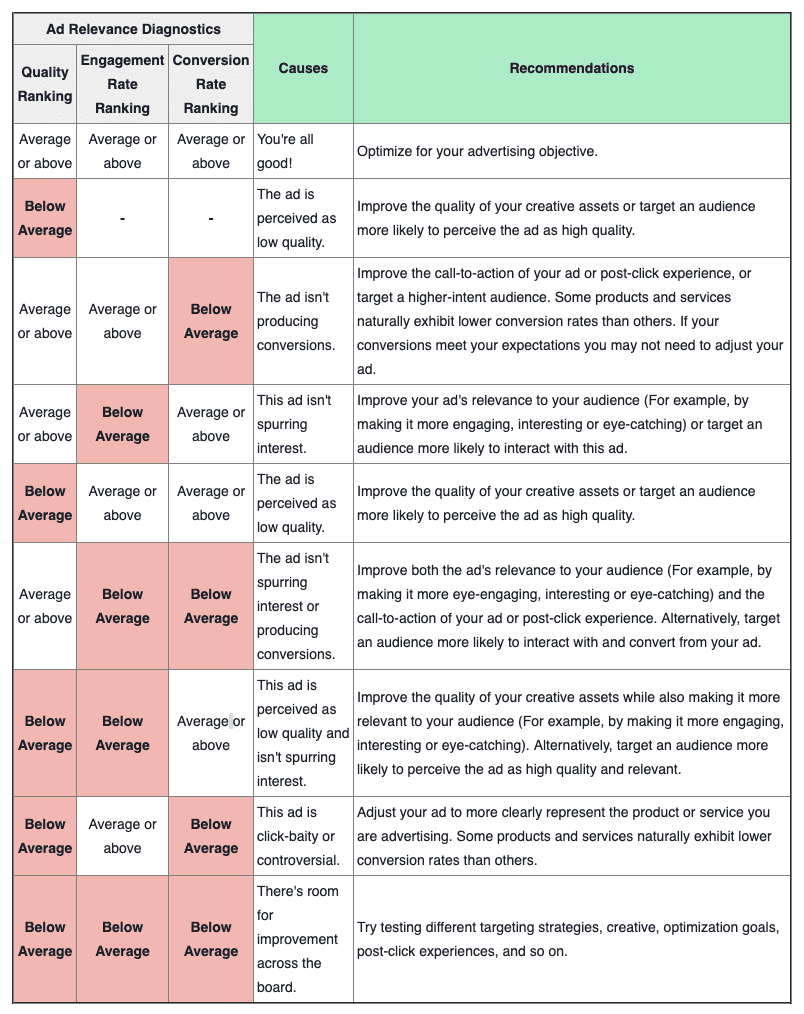
Here’s a rundown of what each diagnostic means and what you can do to increase it:
Quality Ranking
This ranks the perceived quality of your ads in relation to other ads competing for the same audience. In other words, it shows how your audience feels about your ads as opposed to the ads of your competitors at that time.
Facebook calculates this ranking based on feedback from users who have viewed or hidden the ad in their feeds. This isn’t the same thing as reporting, reacting to, or sharing an ad; Facebook only uses data collected from ads that have been deliberately hidden.


Example of feedback that can be provided from an ad hidden on Facebook.
In addition to this feedback, Facebook makes assessments related to clickbait, engagement bait, and other poor user experiences.
Any ad that Facebook’s algorithms deem a poor user experience, such as an incomplete landing page or an inaccurate portrayal of your brand, can lower your score. Just make sure you’re following Facebook’s advertising guidelines and you’ll be okay.
But those guidelines don’t cover clickbait or engagement bait, which are also important factors in how Facebook assesses your ads.
If you’re asking yourself about the difference between clickbait and engagement bait, we’ll clear that up for you as well:
- Clickbait is an ad that intentionally leaves or exaggerates important details of a story in an effort to lure Facebook users to click on the link. This typically leads to high bounce rates:


Clickbait video ad example via Facebook.
- Engagement Bait is an ad that directly asks for likes, shares, and comments in an effort to boost its position in the feed:


Engagement bait examples via Facebook.
Engagement Ranking
This ranks your ad’s expected engagement rate against other ads competing for the same audience. In other words, it tells you how likely your target audience is to react to, share, comment on, or expand your ad in their feed.
It is a great metric for judging how compelling your ad design is for a specific target audience. Consider this example from Facebook regarding targeting:
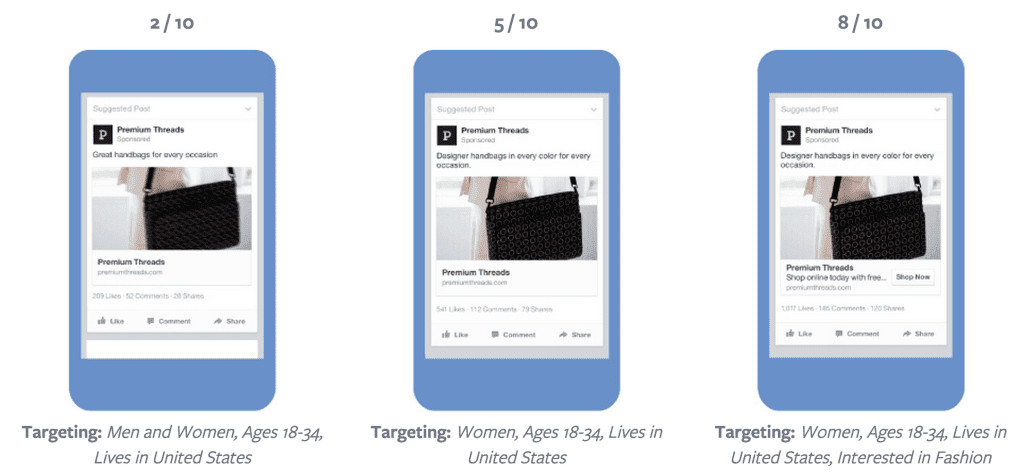

The ad is well designed and clear, so good audience targeting is key for boosting engagement ranking. But remember: Do not participate in engagement baiting, because it will have a negative effect on your overall rank.
Disclaimer: Engagement Rate Ranking isn’t available for some optimization goals, including ad recall life, impressions, reach, and customer conversions or value.
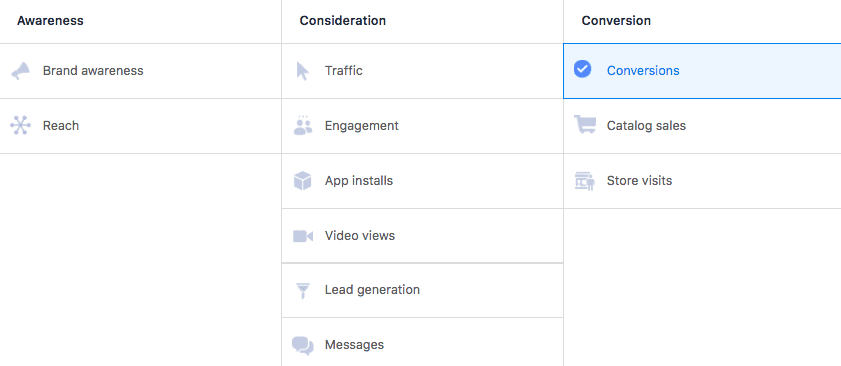
Conversion Rate Ranking
This ranks the potential conversion rate for your ad based on other competing ads for your audience. Basically, it’s a measure of how likely a person is to complete the goal of your ad, whether that’s clicking through to your landing page or filling out a survey, for example.
It’s calculated based on the optimization or conversion goals set for your ads and is, therefore, the most industry-specific and variable ranking:

Disclaimer: Conversion Rate Ranking isn’t available for some optimization goals, including ad recall lift, impressions, reach, and customer conversions or value.
How to Check the Relevance Diagnostics
Add these new relevance diagnostics to your Performance column by Customizing Columns. It’s easy:
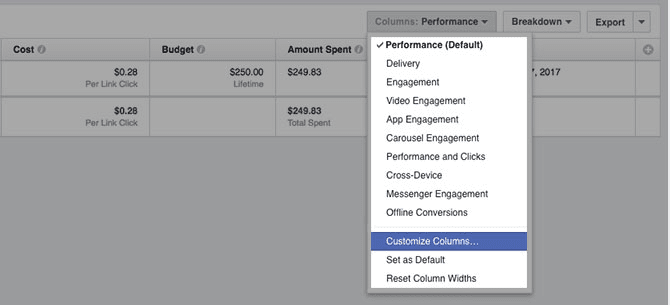

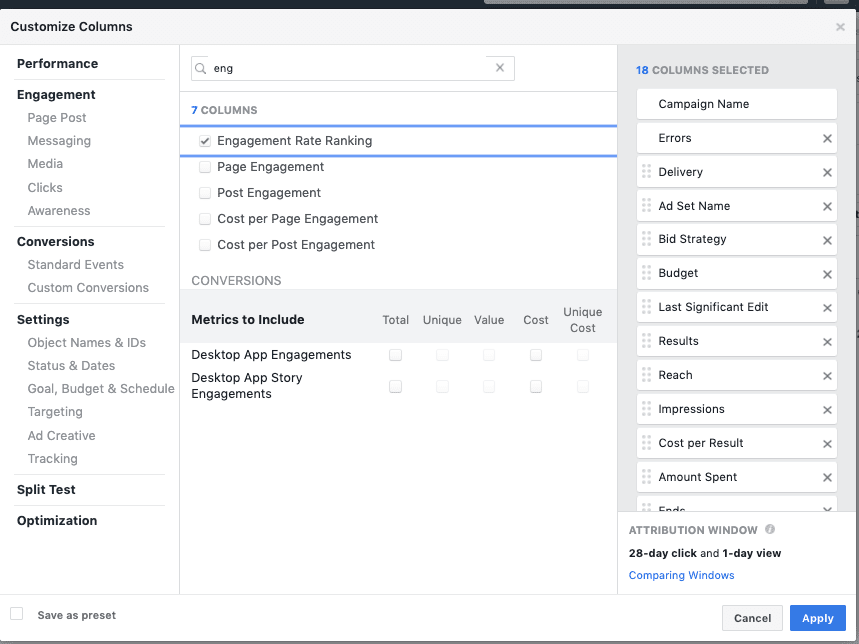

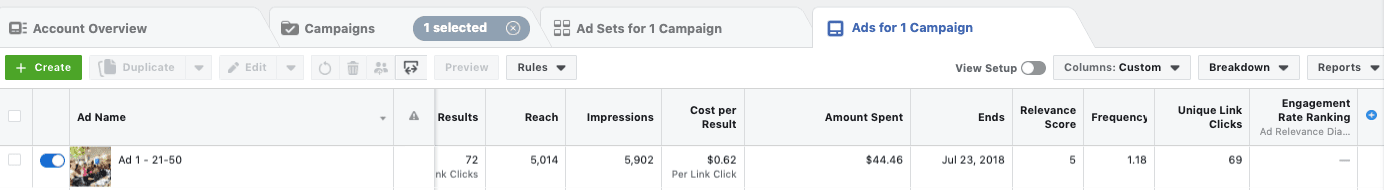
Once that’s done, just go to your Facebook Ads Manager, select a campaign and then an Ad Set. In the “Ads” tab, you’ll get a list of ads, each of which will have its own Relevance Score and Diagnostics.

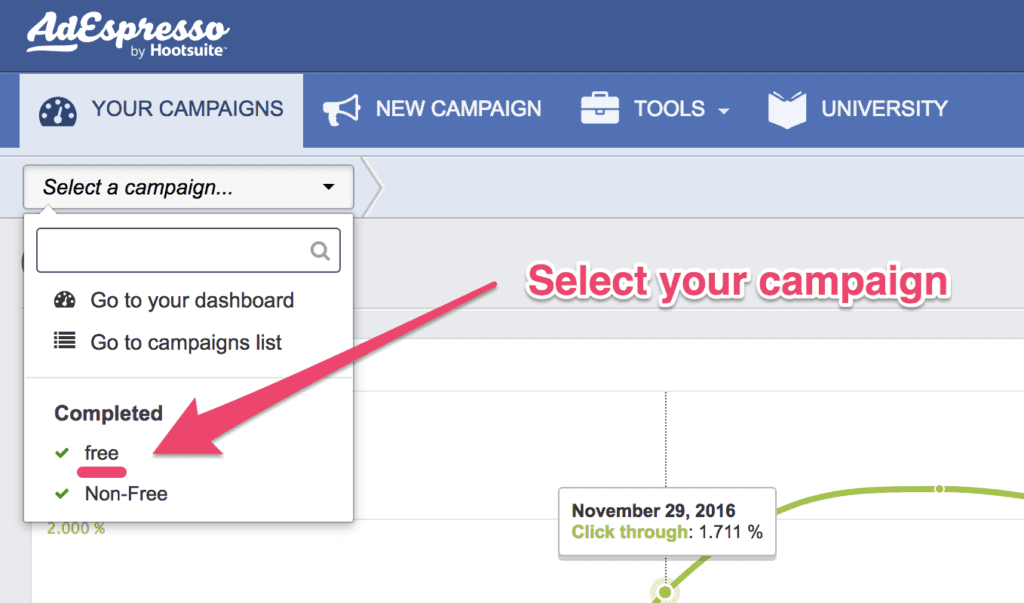
AdEspresso makes it even simpler to see your Relevance Score.
Just select a campaign to pull up your campaign dashboard:

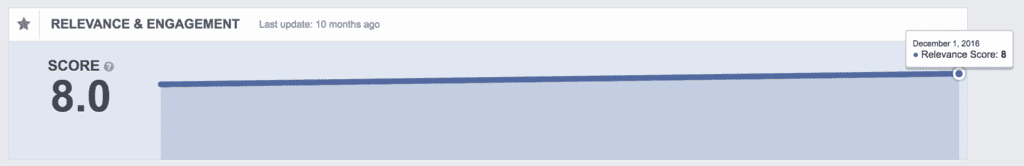
Once there, scroll down. At the bottom is a handy graph of your campaign’s Relevance Score and engagement over time.

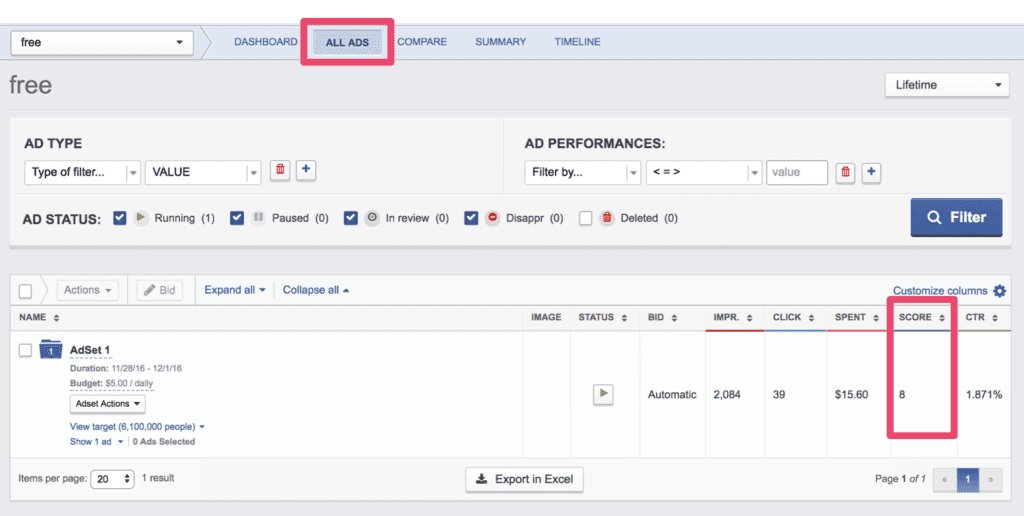
To see your Relevance Score for particular ads in your campaign, switch to the “All Ads” view in the campaign’s menu:

Now you know where to find the information. But what should you do next? Keep reading.
What Does This Mean for You?
As Facebook continues to roll out these Relevance Diagnostics to the rest of their user, you’ll have the opportunity to learn more about how your target audience feels about every ad you create, which helps you build better ads and optimize current campaigns for higher performance.
Facebook has a great breakdown of how to use these rankings to create better ads for your target audience:

It’s a great addition to Facebook’s existing Relevance Score, and it’s the best data you have on what truly resonates with your target audience.
If you’re interested in learning more about Facebook’s current Relevance score, check out the post below our update.
And if you’d like to jump directly to the strategies section, you can click right here.
Relevance Score: Everything You Need to Know in 2017 (Strategies Included)
In 2015, Facebook Ads Manager introduced a sweet new feature: the Relevance Score. If you ever wanted to tell at a glance how well your ad fits with its audience, the Relevance Score has you covered. The metric itself is simple: a score of 1-10—10 meaning that your target audience finds your ad super relevant to their interests and needs.
But what exactly determines your Relevance Score? Facebook says it’s all about “positive and negative feedback” from audiences, but how do you interpret that to make your ads better? Here, we break down how exactly your Relevance Score works. , and it’s not enough! We’ll also lay down the best strategies to achieve your campaign objective and improve your score.
Already understand how Relevance Scores work? Click here and jump to some strategies to up your score!
What is the Relevance Score and Why Does It Matter?
The Relevance Score is a magic number. It’s a score from 1 to 10 that, at first sight, will let you know how relevant an ad is to its audience.
Note the wording. Relevance, not quality.
The scope of this number is not to tell you how good your image or copy is. The main goal here is to make you understand if your ad’s demographic target is considering your message relevant to them and thus engaging with it.
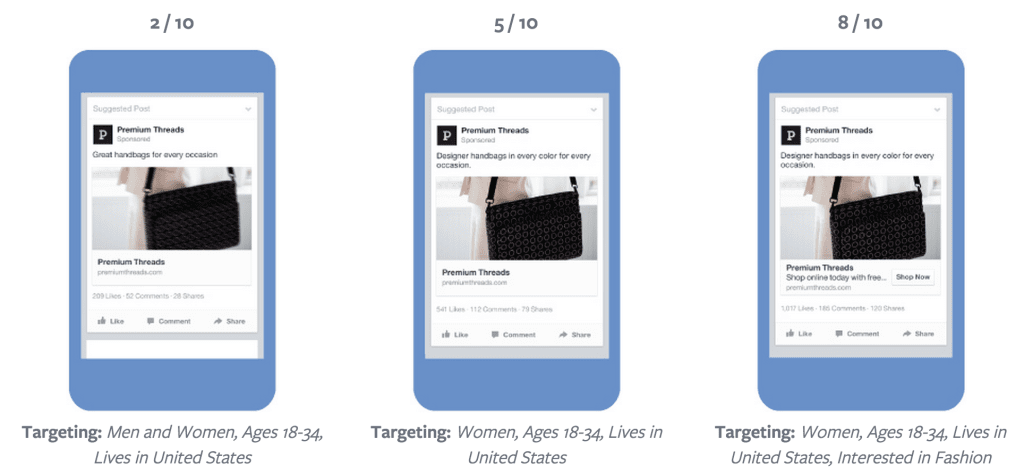
An ad made by the best designer in the world, with the best copy ever written will still have an insufficient score if it’s promoting women’s clothing and it’s being targeted to male teenagers 13-18 years old.
On the other hand, an ad with a decent design and copy targeted to the perfect audience, will enjoy a healthy Relevance Score.
Here’s an example from Facebook:
You may be wondering, “Why does this matter? It is just a number.” It is much more than just a number. The Relevance Score is the synthesis of many metrics: Engagement, Clicks, Conversions, Click-Through Rate, Negative Reviews. With just one number you can quickly understand if an ad will be a winner or a loser.
The Relevance Score also has a direct link to your advertising cost. When Facebook has to decide which ad to display to a specific user, they’ll always prefer to display an ad which they consider relevant to that user. If yours is not, it’ll quickly become very expensive to advertise.
Don’t believe me? Just Watch.
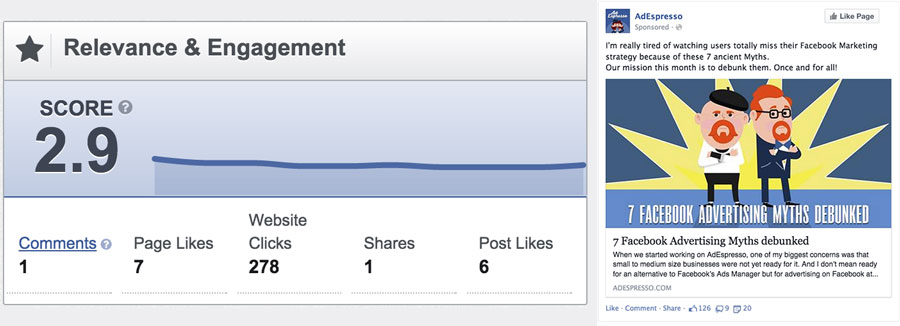

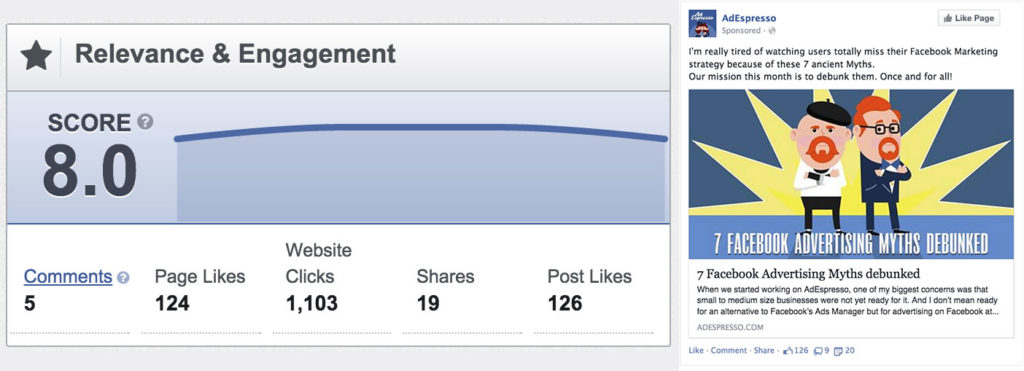

With the same budget we generate 4 times more clicks. 1,103 Clicks to this blog post compared to the 278 of the other campaign. Shares, Likes and Page Likes are through the roof as well! This is just one example of how important the Relevance Score is.
How to Check the Relevance Score
It’s extremely simple. Just go to your Facebook Ads Manager, select a campaign and then an AdSet. In the “Ads” tab, you’ll get a list of ads, each of which will have its own Relevance Score.


Once you’ve gotten to your campaign dashboard, simply scroll down. At the bottom is a handy graph of your campaign’s Relevance Score and engagement over time.

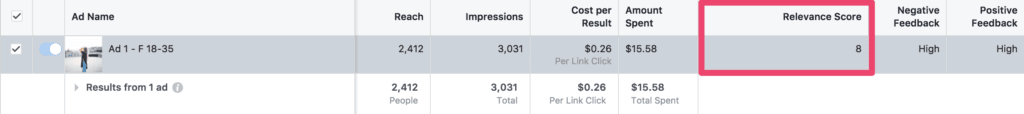
To see your Relevance Score for particular ads in your campaign, switch to the “All Ads” view in the campaign’s menu.
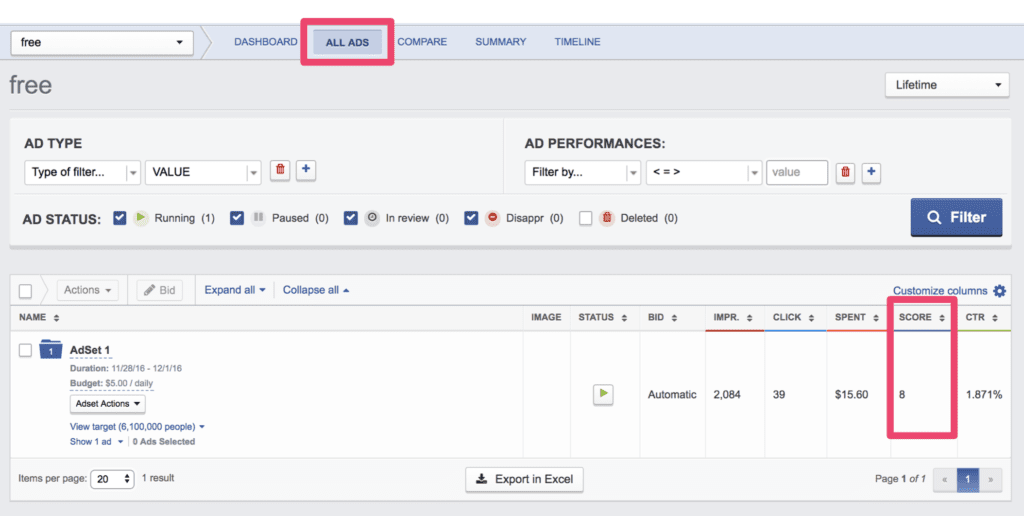
For each ad, you can see the Relevance Score in a right-hand column. Let’s move on to figuring out what it means!
Data Time! What Relevance Score Means for You and What Influences It
Now that you have a good idea of what the Facebook Ad Relevance Score is, let’s check some data.
We analyzed a subset of our database: 104,256 ads created through AdEspresso in the 45 days after the Relevance Score was first introduced.
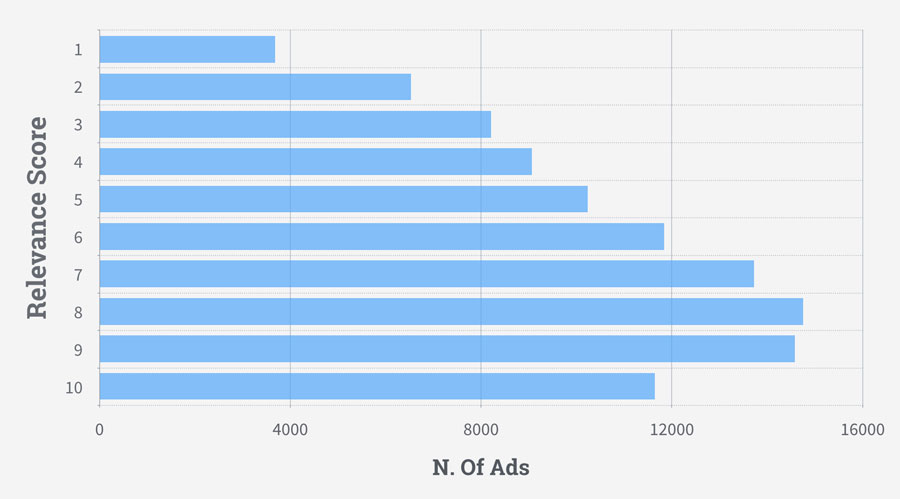
First, we checked the distribution. I would have expected to see a classic bell curve with most of the ads scoring between 4 and 5. Turns out, our customers are amazing and 63% of the ads had a score of 6 or more. 8 was slightly the most common Relevance Score.

I’ve already mentioned that your ads’ relevance will impact Facebook’s willingness to display it in users’ newsfeeds and consequently, how much it will cost.
Let’s see some numbers to prove that:
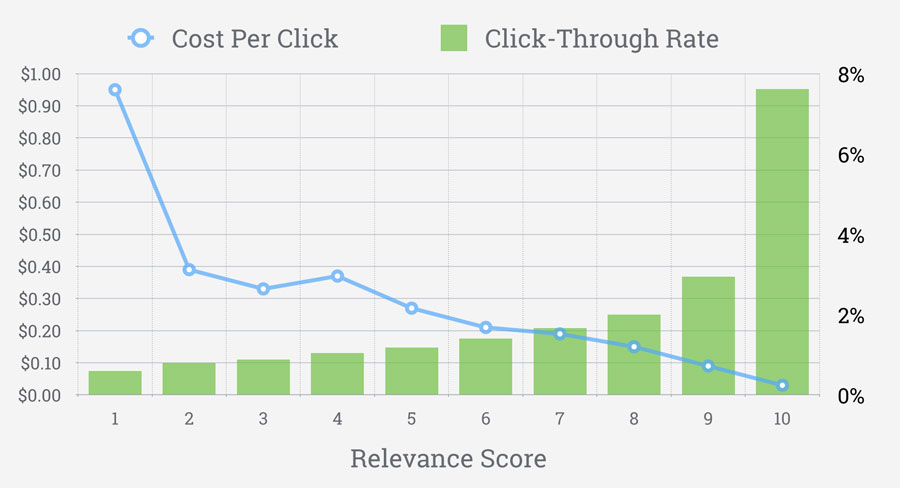

| Score | Ads | CPC | CTR | Avg Shares | Avg Likes | Avg Comments | Avg. Website Clicks |
| 1 | 3,682 | $0.95 | 0.60% | 3 | 13 | 2 | 231 |
| 2 | 6,534 | $0.39 | 0.80% | 2 | 19 | 1 | 137 |
| 3 | 8,205 | $0.33 | 0.88% | 2 | 41 | 1 | 138 |
| 4 | 9,070 | $0.37 | 1.04% | 4 | 52 | 3 | 119 |
| 5 | 10,231 | $0.27 | 1.18% | 35 | 222 | 39 | 286 |
| 6 | 11,838 | $0.21 | 1.40% | 66 | 231 | 78 | 431 |
| 7 | 13,726 | $0.19 | 1.67% | 71 | 214 | 80 | 537 |
| 8 | 14,749 | $0.15 | 2% | 88 | 138 | 43 | 516 |
| 9 | 14,576 | $0.09 | 2.94% | 71 | 83 | 14 | 945 |
| 10 | 11,645 | $0.03 | 7.61% | 170 | 111 | 44 | 2,215 |
Exactly what we expected. The higher the Relevance Score is, the lower the Cost Per Click (CPC) is and the better the Click Through Rate (CTR).
The difference is really big if you reach a Relevance Score of 10—the CPC is extremely low and those ads generated a huge amount of clicks.
The next question is: Are the CTR and the CPC so good because of the high Relevance Score or vice-versa? I tend towards the latter.
The Relevance Score is not a standalone metric, like the number of clicks or impressions, it is a calculated one. The Relevance Score cannot affect the clicks that an ad will receive. It’s exactly the opposite.
If a Facebook ad has a great design and is targeted to the right audience, it’ll have a very good CTR and engagement. This will lead to a lower CPC and to a higher Relevance Score.
The Relevance Score is far from useless, and to a certain extent, you can avoid checking multiple metrics and simply focus on the Relevance Score to understand which ads are performing the best.
Finally, here’s a summary of the metrics that most influence the Relevance Score:
- Negative Signals: When a user hides your ad from their newsfeed, that is a strong indicator that you’re not targeting the right audience.
- Campaign Objective: I think this is the strongest positive influence you can get. If your campaign is aiming at likes and you receive a lot of likes, that’s a good sign. The same goes for Conversions, Website Clicks and so on. The better you perform on your campaign’s goal, the higher your score will get.
- CTR: The higher your click-through rate is, the more relevant your ad is considered by Facebook. This is common sense, as no one would click an ad that is irrelevant to them.
- Shares: My theory is that Facebook believes that sharing an ad is the strongest endorsement on its quality. The numbers above seem to back this theory with a pretty strong correlation between the shares and the score.
- Likes & Comments: While the data doesn’t show a clear correlation, I think likes and comments are considered by Facebook as positive quality signals. Comments may be a bit trickier because without understanding the context, it’s tough to attribute them a positive or negative value.
4 Strategies To Improve Your Facebook Ads’ Relevance Score
Remember what this is all about: Relevance.
To increase your Relevance Score, you simply have to craft appealing Ads that directly address the needs and wants of your very specific audience.
Here are four actionable strategies to improve Facebook Ad Relevance Score:
#1. Lower Your Ad Frequency
Ever get annoyed by how many times the same ad shows up in your Feed? It’s tempting to just block the thing.
That’s how your viewers feel when your ad frequency, the average number of times a person sees your ad, is too high.
We found that the higher the frequency, the greater your Cost per Click (CPC) and the lower your Click Through Rate (CTR).
The graph below shows our results from analyzing 500 campaigns over a few months. Notice how there’s a steep increase in CPC once the frequency gets to 5.
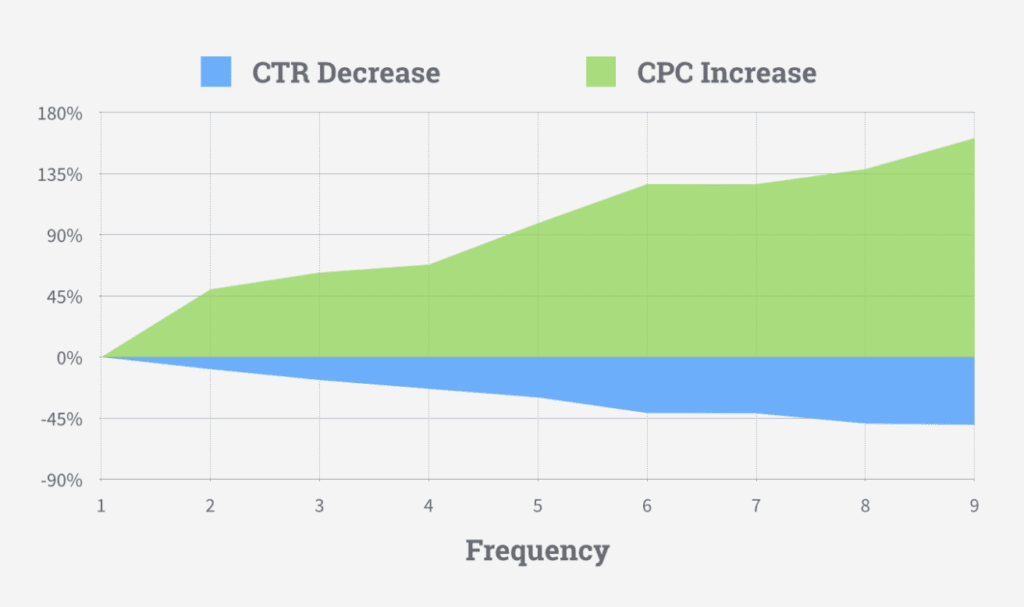

There’s no hard and fast frequency to use as a threshold because everyone’s campaign is different, and the frequency is just an average.
But as you edit your ads, keep in mind that you should look for the balance between building an impression on people, while not annoying them through ad repetition.
Keeping your ads fresh is especially important for avoiding getting blocked or “hidden”, which would lower your ad’s Relevance Score.
Another way to keep your ad frequency low is to go into Custom Audiences and exclude people who have already converted to your business.
If your ad objective is to boost conversions, then boosting your ad to people who have already converted may only serve to annoy them.
Frequency is a good indicator of when your ads are on the precipice of getting negative feedback, which lowers your ad’s Relevance Score.
#2. Design Ads Based on Buyer Personas
Increasing your Relevance Score is all about fitting your ad with your audience.
The more detailed your buyer personas, the more you have to work within your ad design towards a niche audience.
To build a great buyer persona, first determine your different buyers in as many demographic details as possible—Facebook Audience Insights can give you a sense of the categories to choose from.
Then, figure out your customer’s pain points through customer research, or even through competitive analysis. You can turn these pain points into a strong value proposition to feature in your ad.
The last step is to design your ads for each buyer persona by incorporating those demographic details and pain points.
Below are two example ads that we generated from two buyer personas: a digital marketing agent (left) and a startup entrepreneur (right).
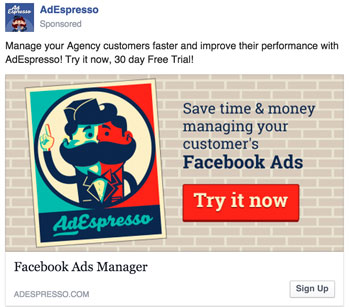
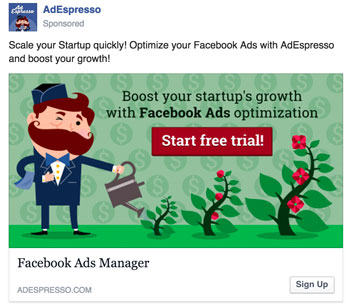
Notice that each ad mentions front and center the specific customer pain point. For startups, it’s growth, and for marketing, it’s time.


With buyer personas in mind, it’s easy to design your ad to provide a unique value proposition for each segment of your target audience.
A well-designed niche ad leads to more click-throughs, in turn increasing your Relevance Score.
#3. Aim at Audiences With Intersecting Interests
Click-through rate factors into your Relevance Score—the higher your CTR, the higher your score.
That doesn’t mean you have to make your ad clickbait, though.
The elegant and effective way to get people to click on your ads is to target people with multiple, intersecting interests that your product represents.
That means if you’re advertising something—say a college football event with free tacos—the trick is to target users who like both football and tacos. Just input the different topics into the Interests section of Facebook’s Ad Manager, and select “all of these” interests to get your intersection.
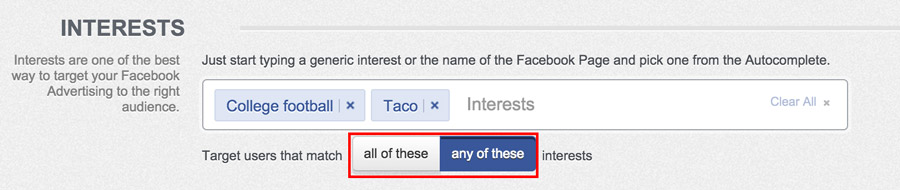

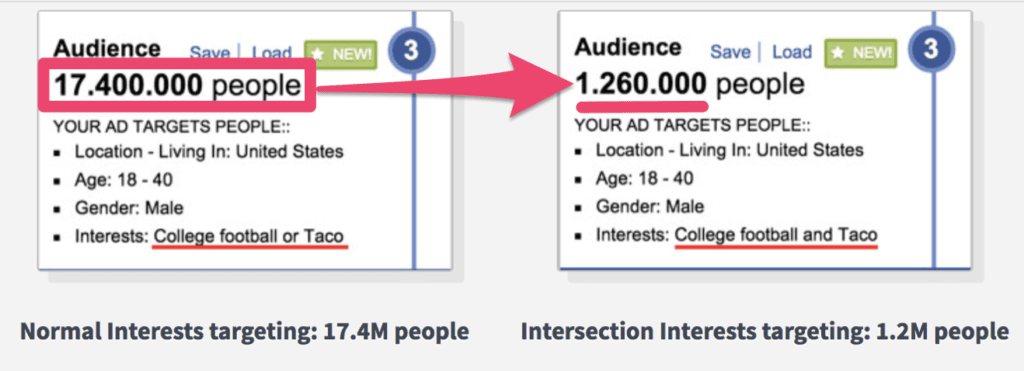
Targeting users that match all of these interests will whittle down your audience to those who will really get a kick out of your event, and thus are more likely to engage with it via a click or a “Going” RSVP.
A high CTR improves all campaign objectives, whether it’s promoting an event, driving traffic to your site, or smashing product catalog sales.
And guess what? The better your ad achieves your campaign objectives, the higher your Relevance Score.
#4. Run Your Ads at Strategic Times of Day
To improve your Relevance Score, you’ll have to improve your ad timing. That’s because your product is probably going to be more relevant at certain times of the day and not others.
Choosing the best time to run your ads depends on the behavior of your audience segment.
For example, an ad for a hot meal is going to be more relevant for most people around their dinner time than in the middle of the night. Essay editing services are going to seem more enticing to students when they’re staying up at 1AM.
Once you understand your target audience’s behavior and pain points, you can optimize when your ad appears in their Feed.
To get a sense of optimal time to post your ad, use Facebook insights or analytics tools like Hootsuite to check the time stamps on when people are most engaged.
Below, we show how those analytics might look for post engagement:
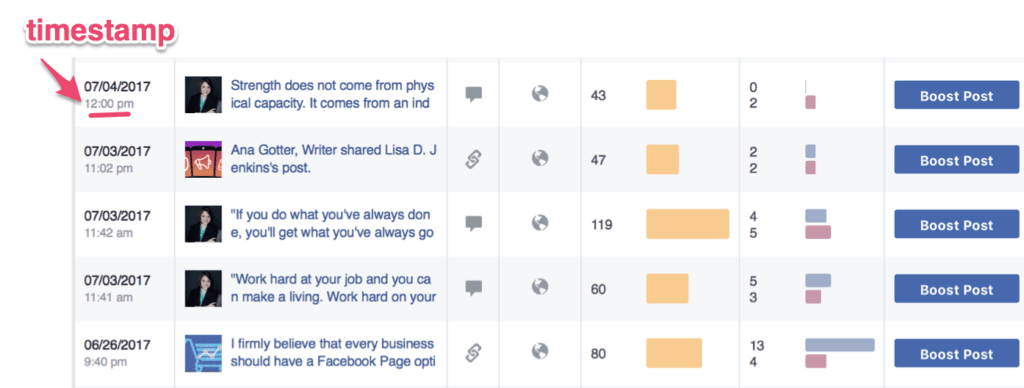

AdEspresso makes it really easy to do this with the Dayparting feature, which allows you to schedule your campaign’s live hours, within and outside of your time zone.
Not only will this scheduling save you money, it will also ensure that your ads are getting optimal exposure. That boosts your chances of getting more positive customer feedback, which directly boosts your Relevance Score.
Don’t Forget…
There are a lot of metrics that go into your Relevance Score, and it can seem like a lot to keep track of.
Remember that no one nails their ad re-design on the first try. Split-test everything to find what’s optimal for your campaign objective.
That way, you can scale your campaign confidently, based on the best-performing ads with the highest Relevance Scores. For more on how to split-test, we got you covered.
Another thing to remember is: don’t over-obsess on improving your Relevance Score!
In the end, it’s just an estimate of how well your ads resonate with your viewer.
What’s more important are the core metrics that make your business grow.
So if your ad’s Relevance Score is low, but your campaign generates a positive ROI, all the score tells you is you have room to improve!
Your turn now!
I hope this data backed analysis of Facebook’s Relevance Score helped you better understand how it works and how you can benefit from it.
Now it’s your turn to go check your campaigns and improve them.
While you are at it, why not share your findings in the comments below? What is your average Relevance Score, and what worked well to improve it?
Let us know, and we’ll compare findings!