
Engagement rates are the bread-and-butter of social media marketing.
Sure, metrics like impressions, likes, and followers are easy to report on and bring marketers a sense of accomplishment. But engagement metrics like comments, mentions, and shares are what actually tells you whether your social media marketing efforts are paying off or not.


The strange thing is that, despite how important engagement rate is, there’s no standard formula to calculate it.
In this article, we’ll cover what engagement rate actually is and why you should track it, and provide you with 6 foolproof formulas to calculate it properly.
What is engagement rate?
Engagement rate is a metric that tracks the amount of interaction your social media content earns per follower.
On social media, the term “engagement” usually refers to active interactions, rather than passive ones like views and impressions. Engagement can come in the form of likes, shares and comments, DMs, mentions, saves, click-throughs, etc. depending on the social platform you use.
Engagement rate is used to analyze the efficacy and effectiveness of brand campaigns. This is because users who interact with images, blogs, and videos are more likely to convert than people who just scroll past your content.
There are many ways to calculate engagement rate, and different formulas may be better suited for your social media objectives.
Why should you track engagement rate?
Many brands consider an increase in social media followers as growth. While this is true, an increase in followers will not do much for your business if said followers don’t interact or enjoy the content you post. You need likes, comments, shares, and other actions that show that your content resonates with your audience.
That’s why you should track engagement rate. Your engagement rate shows you if your audience finds your content engaging, relevant, and helpful. If your followers are willing to take time to comment and share your post, it means that they’re happy with your content and are likely to buy your product one day.
Some common engagement metrics
In the previous sections, we hinted at actions that count as engagement. But below’s an extensive list of these actions that show you that your followers are interacting with your content. You can include some or all of these interactions in your equations.
- Likes
- Reactions
- Comments
- Shares
- Direct Messages (DMs)
- Post saves
- Mentions (tagged and untagged)
- Profile visits
- Replies
- Clicks
- Click-throughs
- Link clicks
- Quote tweets
- Retweets
- Regrams
- Emails
- Calls
- Texts (WhatsApp or SMS)
- Use of branded hashtags
- Get Directions (only for Instagram accounts)
- Sticker Taps (Instagram Stories)
Six formulas to calculate engagement rate
Here are the most common formulas you need to know to calculate your social media engagement rates.
Engagement rate by reach (ERR)
Engagement rate by reach (ERR) is the most common formula for calculating engagement rate. It measures the percentage of users who interacted with your content after viewing it.
To calculate the ERR for a single post, the formula is:
ERR = Total engagements per post / reach per post x 100
To calculate the average ERR across several posts, use this formula:
Average ERR = [Post 1 (ERR) + Post 2 (ERR) +… + Post N (ERR)] / N x 100
It will look something like this: Post 1 (2.8%) + Post 2 (3.3%) / 2 = 3.05%
Compared to follower count, Engagement Rate by Reach (ERR) is a more accurate way to calculate engagement rate because not all your followers will see your content. And people who are not following can still see your content through hashtags, shares, and other promotion methods.
That being said, reach fluctuates for different reasons, which means it’s a difficult variable to control. Brands with lower reaches can have extremely high engagement rates that don’t accurately reflect their real interactions.
Engagement rate by posts (ER post)
This formula measures your engagement by followers on a particular post. It’s similar to ERR, but instead of reach, this formula tells you the rate at which your own followers interact with your content.
Here’s how to calculate your ER post:
ER Post = Total engagements per post / Number of followers x 100
To calculate the average ER post, add up all the ER posts and divide by the total number of posts, like this:
Average ER by post = (ER Post 1 + ER Post 2 + … + ER Post N) / N
It will look like this: Post 1 (3.5%) + Post 2 (3.2%) + Post 3 (3.8%) / 3 = 3.5%
While ERR is a better way to measure engagement based on how many people have seen your content, this formula replaces reach with followers, which is a more stable metric to track. So if your reach fluctuates a lot, you use this formula to get an accurate measure of your post engagement.
However, this formula does not account for viral reach so you won’t get the full picture of how your posts are really performing. Also, your engagement rate can reduce slightly as your follower count increases.
ER by post can’t help you understand the problems your audience has and how to solve them. So you should use this formula alongside other growth metrics. For instance, interactions like comments on IG posts might not be as valuable as less public interactions like shares and saves (depending on your advertising goals).
Engagement rate by impressions (ER impressions)
While ERR measures how many people see your social content, ER by impressions tracks how often your social content appears on people’s screens.
Here’s how to calculate ER impressions:
ER impressions = Total interactions per post / Total impressions x 100
Average ER impressions = [Post 1 (ER impressions) + Post 2 (ER impressions) + … + Post N (ER impressions)] / N
This formula works great if you run paid content and you want to know how effective your paid campaign is based on impressions.
The downside of this formula, however, is that ER impressions will show less engagement than ERR and ER post equations. Just like reach, impressions can also be inconsistent. So if you’re using this formula, use it alongside reach for more accurate results.
Pro-tip: Reach is different from impressions. Reach refers to the number of people who’ve seen your post, while impressions show how many times people saw your content. So if 200 people saw your ad, your reach is 200. But if each of those people saw your ad twice, your impressions are 400.
To learn more about the difference between reach and impressions, check out this article.
Daily engagement rate (Daily ER)
ERR measures engagement against your total exposure, but you should still know how often your followers engage with your content every day
Here’s how to calculate your daily engagement rate (daily ER):
Daily ER = Total engagements per day / Total followers x 100
Average Daily ER = (Daily ER 1 + Daily ER 2 + … + Daily ER N) / N
This formula is great for gauging how often people engage with your brand every day, as opposed to how they engage with certain posts. So it takes into account the engagements on both old and new posts.
You can also tailor your Daily ER to specific variables, like comments or shares.
The disadvantage of this formula is that it can easily be inaccurate. It doesn’t consider the fact that the same follower may write 5 comments on your posts in a day, which is different from 5 followers writing one comment each.
Your daily engagement can also vary for different reasons, including how many posts you make in a day. That’s why you should calculate your daily ER in relation to your number of posts.
Engagement rate by views (ER view)
If your main content format is video, then you need to know how many people engage with your videos after viewing them.
Here’s the formula for ER view:
ER view = Total engagements on video post / Total views x 100
Average ER view = (ER view 1 + ER view 2 + … + ER view N) / N
If one of your goals is to generate engagement through your videos, this formula can help you track it. However, this formula does not account for repeat views. So if someone watches your videos more than once, but doesn’t engage with them each time (with likes, comments, shares, etc.) your ER view will reduce.
Pro-tip: If you post on YouTube, you can use a free plugin (e.g. Keywords Everywhere) to estimate how much engagement your channel is receiving.
Factored Engagement Rate
Factored engagement rates add more or less value to certain engagement indicators of a post. So instead of counting each engagement indicator once, a social media marketer assigns a numerical value to some of them.
For instance, the marketer might choose to place more weight on shares than on likes. They can weigh each share as two versus one (for likes). The equation to calculate this engagement rate would look like this:
Share-weighted ER = (Total shares x 2) + all the other engagements / reach per post multiplied by 100
This formula can be misleading as it dilates the resulting engagement rate. This is why we don’t recommend that you use it.
How to calculate cost per engagement
The purpose of calculating your engagement rate is to know the quality of your content, how your brand stacks up against your competitors, and if you’re getting good returns on your paid ads or sponsored content.
To know if you’re spending your money well, you need to know your cost per engagement (CPE). The formula to calculate it is:
CPE = Total amount of money spent / Total number of engagements
Most social media ad platforms actually calculate this for you, as well as other cost calculations like cost-per-click.
Free engagement rate calculator
Now that you know all the formulas to calculate your engagement rate, you can try this free engagement rate calculator built by the team at Hootsuite.
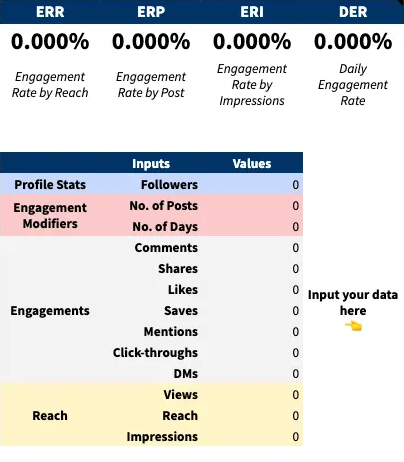

This calculator makes it easier and quicker to get your engagement rate. All you need is Google Sheets. Click File and select Make a copy to start plugging numbers into the fields.
Example: If you want to calculate the engagement rate of one post, type “1” in No. of Posts. To calculate the engagement rate of multiple posts, type the total number of posts in the No. of Posts tab.
How to track your engagement rate automatically
Calculating your engagement rate manually takes a lot of time and brainpower. If you want to take an easier route (and why wouldn’t you!), use a social media analytics and management tool like Hootsuite.
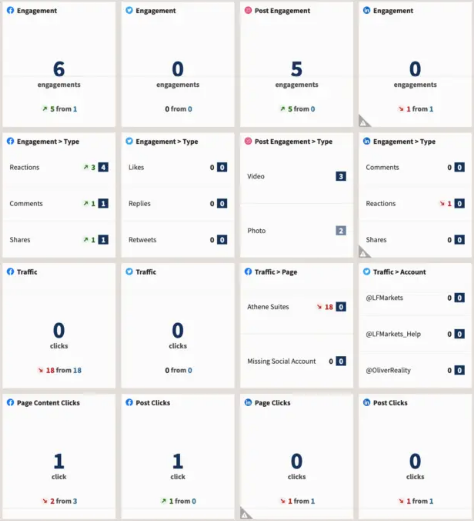
Hootsuite helps marketers, business owners and social media pros evaluate social media engagement across social media platforms via detailed, customizable report. Here’s what a cross-platform engagement report looks like in Hootsuite:

And here’s a Hootsuite report showcasing engagement rate on Instagram.
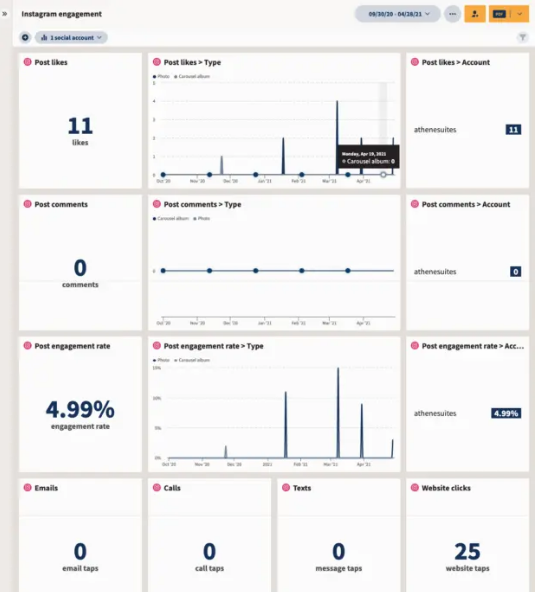

With both reports, it’s easy to see how many engagements you got during a reporting period, the engagement indicator Hootsuite is counting for each network, and compare your current engagement rates to previous time periods.
You’ll also be able to see which posts performed well during a period of time, and use that data to create more effective posts in the future. What’s more, you can set up your reports to be created automatically.
What is a good engagement rate?
A good engagement rate depends on how many followers you have, the kind of content that you put out, and your marketing objectives, amongst other things. However, most social media marketing experts believe that an engagement rate of 1% – 5% is ideal.
To determine if your engagement rate is good or bad, you need to benchmark it against something else. For example, you can compare your social media performance against your competitors, or compare your performance across different social media platforms (your own social profiles).
To learn more about this, check out this guide to boosting your engagement rate.